
A normal API can be healthy while an AI application is completely wrong.
The server may return:
HTTP 200
Latency: 1.2 seconds
while the model:
used the wrong document

called the wrong tool

ignored a system instruction

hallucinated a policy

spent $0.08 instead of $0.01

took an unnecessary reasoning path

gave a confident but incorrect answer
Traditional application monitoring cannot tell you most of that.
That is why LLM observability has become its own engineering category.
Instead of monitoring only:
CPU
memory
HTTP status
exceptions
request latency
an AI application also needs visibility into:
prompts
model calls
retrievals
tool calls
agent steps
token usage
cost
user feedback
evaluation scores
conversation sessions
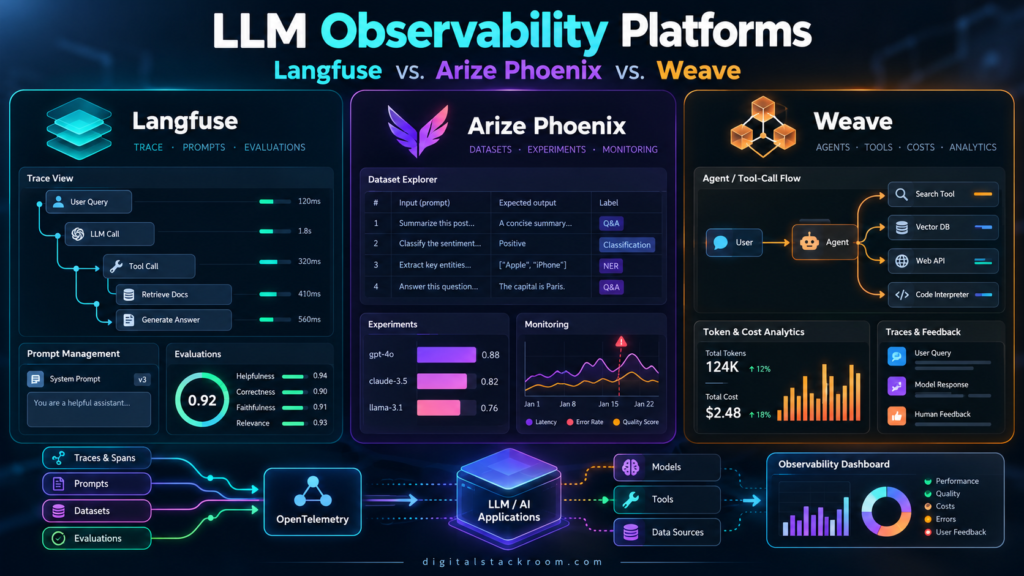
Three platforms that regularly appear in this discussion are:
Langfuse

Arize Phoenix

Weights & Biases Weave
They overlap significantly.
All three can help you inspect LLM calls, understand agent behavior, evaluate outputs, build datasets from real examples, and compare changes.
But they come from noticeably different product philosophies.
The way I think about them is:
Langfuse
→ integrated LLM application engineering platform

Phoenix
→ standards-first tracing and evaluation platform

W&B Weave
→ GenAI observability inside a broader ML/AI engineering ecosystem
That distinction matters much more than a simple feature checklist.
Table of Contents
Why LLM Observability Is Different from Traditional Monitoring
Suppose a support agent receives:
Customer:
Can I change the shipping address for order 18372?
The application might execute:
User request
      ↓
Intent classifier
      ↓
Retrieve policy
      ↓
Order lookup tool
      ↓
Reasoning step
      ↓
LLM response
The final HTTP request might succeed.
But several AI-specific failures are possible.
Retrieval Failure
The retriever selects:
Returns Policyinstead of:
Shipping Address Change PolicyTool Failure
The agent calls:
cancel_order()instead of:
get_order()Prompt Failure
A new prompt version accidentally removes:
Never modify an order without explicit confirmation.Hallucination
The model invents:
You can update any order for 48 hours.
even though the policy says 30 minutes.
Cost Regression
A workflow that previously required:
2 model callsnow performs:
11 model callsbecause an agent loop stops terminating correctly.
Quality Regression
Latency improves after switching models, but factual accuracy drops.
Traditional infrastructure monitoring might report:
Service healthy.An LLM observability platform should help you discover:
Application unhealthy.Those are different questions.
Logs, Traces, and Evals Solve Different Problems
It is useful to separate three concepts.
Logs
Logs describe events.
{
  "severity": "ERROR",
  "message": "Tool call failed",
  "tool": "lookup_order"
}
For general cloud-service monitoring, see:
Structured Logging and Monitoring: How to Debug Production Services in Cloud Environments
Traces
A trace shows the execution path.
support_agent
│
├── classify_intent
│
├── retrieve_policy
│   └── vector_search
│
├── lookup_order
│
└── generate_response
It answers:
What actually happened during this request?
Evaluations
An evaluation asks:
Was the result good?
Examples:
Correctness: 0.94

Groundedness: 0.87

Tool selection: PASS

Policy compliance: FAIL

User rating: thumbs_down
An effective LLM engineering platform increasingly needs all three:
Observe
→ Measure
→ Improve
The Core AI Observability Loop
A mature workflow usually looks something like this:
Production
    ↓
Trace real traffic
    ↓
Identify bad examples
    ↓
Add examples to dataset
    ↓
Create hypothesis
    ↓
Change prompt/model/retrieval/code
    ↓
Run experiment
    ↓
Evaluate
    ↓
Compare with baseline
    ↓
Deploy
    ↓
Continue monitoring
This is where Langfuse, Phoenix, and Weave increasingly overlap.
The difference is how naturally each platform supports different parts of that loop.
Langfuse vs. Phoenix vs. Weave: Quick Comparison
| Area | Langfuse | Arize Phoenix | W&B Weave |
|---|---|---|---|
| Primary focus | LLM/agent engineering lifecycle | AI tracing, evaluation and experimentation | GenAI tracing/evaluation within W&B |
| Tracing | Excellent | Excellent | Excellent |
| OpenTelemetry | Native foundation | Core design principle | Supported |
| OpenInference | Supported via ecosystem | Central to Phoenix ecosystem | Supported through OTEL integrations |
| Agent traces | Yes | Yes | Yes |
| Sessions | Yes | Yes | Yes |
| Token/cost visibility | Strong | Strong trace visibility | Strong |
| Datasets | Yes | Yes | Yes |
| Experiments | Yes | Yes | Yes |
| LLM-as-judge | Yes | Yes | Yes |
| Code-based evaluators | Yes | Yes | Yes |
| Human annotation | Yes | Yes | Supported through evaluation workflows |
| Production scoring | Yes | Yes, with platform distinctions | Monitors/scorers |
| Prompt management | Excellent | Strong | Available, less central |
| Prompt deployment/version labels | Excellent | Prompt Hub/workflows | Versioned objects/workflows |
| Prompt playground | Yes | Yes | Yes |
| Alerts | Yes | Phoenix OSS is more limited; AX expands monitoring | Monitors/platform monitoring |
| Self-hosting | Yes | Yes | Enterprise/private W&B deployment options |
| Open/source-available stack | Strong | Strong | SDK/tooling open; platform is W&B service |
| ML experiment ecosystem | Limited to AI app workflow | AI application focused | Excellent |
| Best fit | Production LLM products | Standards-first AI engineering | Teams already using W&B |
This is not a winner-takes-all comparison.
The surrounding engineering stack changes the answer.
Langfuse: An Integrated LLM Engineering Control Plane
Langfuse began as an observability platform, but describing it as merely a tracing tool is now inaccurate.
Its current platform combines:
Tracing

Sessions

Agent graphs

Prompt management

Datasets

Experiments

Evaluations

Annotation

Dashboards

Alerts

Cost tracking
in one product.
The important architectural idea is that these pieces share the same data.
A production trace can become:
a dataset examplewhich becomes:
an experiment inputwhich receives:
evaluation scoreswithout constantly exporting data between unrelated tools.
Langfuse Trace Model
A request can contain multiple observations.
For example:
support-agent
│
├── retriever
│
├── embedding
│
├── tool
│   └── database query
│
└── generation
Langfuse supports observation types including:
span

generation

agent

tool

chain

retriever

embedding

evaluator

guardrail
This is useful because an LLM application is not just a tree of generic spans.
Knowing that something is a:
retrieverrather than:
generic functionmakes the trace much easier to interpret.
Basic Langfuse Python Tracing
The current Langfuse Python SDK is OpenTelemetry-based.
A simple example:
from langfuse import observe


@observe(as_type="retriever")
def retrieve_documents(query: str):

    return vector_store.search(
        query=query,
        limit=5,
    )


@observe(as_type="agent")
def answer_question(query: str):

    documents = retrieve_documents(
        query
    )

    return generate_answer(
        query=query,
        documents=documents,
    )
Langfuse records the execution hierarchy.
Conceptually:
answer_question
    ↓
retrieve_documents
    ↓
generate_answer
along with timing and the associated trace context.
Langfuse Is Now Built Around OpenTelemetry
This is an important development.
OpenTelemetry provides a standard model for:
traces

spans

context propagation
rather than forcing every AI observability platform to invent its own instrumentation format.
Langfuse’s current SDK architecture is OpenTelemetry-based, and the platform can also ingest telemetry through OTel-compatible paths.
That reduces the amount of proprietary instrumentation your application needs.
Langfuse Sessions Are Useful for Conversational Applications
Consider:
Turn 1:
Where is order 127?

Turn 2:
When will it arrive?

Turn 3:
Can I change the address?
Those are three requests.
Operationally, however, they belong to one conversation.
Langfuse sessions allow related traces to be grouped.
Conceptually:
Session
│
├── Trace 1
├── Trace 2
└── Trace 3
This becomes important when debugging issues such as:
context loss

incorrect memory

conversation drift

repeated tool calls

escalation failures
that cannot be understood from one request alone.
Langfuse User Tracking Helps With Cost Analysis
Suppose your SaaS platform wants to know:
Which customers are generating the highest AI cost?
You can associate telemetry with:
user ID

session ID

metadata

tags
Then analyze:
token consumption

model usage

cost

quality

latency
by user or tenant.
For a multi-tenant SaaS application, this can support decisions around:
rate limits

plan design

AI usage quotas

cost attribution
Langfuse Prompt Management Is One of Its Strongest Features
Prompt management is where Langfuse stands out.
Instead of keeping:
SYSTEM_PROMPT = """
You are a support agent...
"""
hardcoded inside application code, a prompt can be centrally managed and versioned.
Langfuse treats every saved prompt change as a new version.
Versions and Labels
Suppose your prompt has:
Version 12
Version 13
Version 14
You can assign labels such as:
production → Version 12

staging → Version 14
Your production application fetches:
productionrather than:
version 12That means deployment becomes:
Move production label
from version 12
to version 14
instead of:
edit prompt in source code
→ commit
→ build
→ deploy application
Prompt Rollback Becomes Simple
Suppose Version 14 reduces answer quality.
Instead of reverting application code:
production → Version 12can restore the previous prompt.
That separation is particularly useful when:
engineers own application code

product/domain teams own prompt behavior
Prompt Caching Matters in Production
Fetching a prompt from a remote control plane on every model call would introduce:
latency

availability dependency
Langfuse SDKs therefore support client-side prompt caching.
The basic architecture becomes:
Application
    ↓
local cached prompt
    ↓
LLM
with background refresh from Langfuse according to the configured cache behavior.
This means central prompt management does not need to sit synchronously in the critical path for every model call.
Langfuse Evaluations
Tracing tells you what happened.
Evaluation tells you whether it was good.
Langfuse supports several quality signals:
LLM-as-a-judge

code-based evaluation

user feedback

manual annotation

custom scores

external evaluation pipelines
For example:
from langfuse import get_client


langfuse = get_client()


langfuse.create_score(
    trace_id="trace_123",
    name="correctness",
    value=0.92,
)
A trace can therefore accumulate:
latency

cost

token usage

correctness

groundedness

user rating
in one place.
Production Evaluation vs. Offline Evaluation
These are different workflows.
Online Evaluation
Score live traffic.
Production request
      ↓
Trace
      ↓
Evaluator
      ↓
quality score
Useful for detecting:
groundedness decline

safety regression

bad tool selection

model-quality changes
Offline Evaluation
Use a curated dataset.
Dataset
   ↓
Version A
Version B
   ↓
Evaluators
   ↓
Compare
Useful before deployment.
A mature AI team should normally use both.
Langfuse Datasets and Experiments
Suppose you find 50 production failures involving:
ambiguous refund requestsThose traces can become test cases.
Your dataset might contain:
| Input | Expected Behavior |
|---|---|
| “Refund order 193” | Ask for confirmation |
| “Can I get my money back?” | Explain policy |
| “Cancel and refund” | Validate order eligibility |
Then compare:
Prompt v12

vs.

Prompt v14
on the same examples.
This turns prompt engineering from:
This wording feels better.
into:
Version 14 improved our refund-policy evaluator from 84% to 93%.
That is a much stronger engineering process.
Langfuse Self-Hosting
Langfuse can be self-hosted.
Supported deployment patterns include:
Docker Compose

Kubernetes

cloud infrastructure
For production environments, Langfuse recommends an architecture designed for scaling and durability rather than treating a single Docker Compose instance as highly available infrastructure.
This matters for teams that cannot send:
customer prompts

retrieved documents

model outputs

agent traces
to an external SaaS platform.
Some enterprise/add-on capabilities may require additional licensing even when the platform is self-hosted, so review the current feature matrix before assuming every cloud enterprise feature is included in the base open-source deployment.
Where Langfuse Fits Best
Langfuse makes particular sense when your AI application lifecycle looks like:
Build prompt
   ↓
Deploy prompt
   ↓
Trace production
   ↓
Evaluate output
   ↓
Collect failure examples
   ↓
Build dataset
   ↓
Run experiment
   ↓
Promote new prompt
It is especially attractive if:
prompt management matters

you need self-hosting

you want tracing + evaluation together

you want product/domain teams involved

you want one LLM-specific control plane
Arize Phoenix: Standards-First AI Observability
Phoenix has a different feel.
Its foundation is closely aligned with:
OpenTelemetry
+
OpenInference
rather than starting with a proprietary application data model.
Phoenix is designed for:
tracing

evaluation

datasets

experiments

prompt engineering

AI troubleshooting
and it places a strong emphasis on open instrumentation.
Phoenix and Arize AX Are Not the Same Product
This distinction is essential.
Arize currently has multiple AI engineering products.
Phoenix
Phoenix is the lightweight, self-hostable platform for:
tracing

prompt engineering

evaluation

datasets

experiments
Arize AX
Arize AX is the broader enterprise AI engineering and production platform.
Some enterprise capabilities such as broader continuous production monitoring and advanced organizational operations belong to AX rather than Phoenix OSS.
So a comparison that says:
Phoenix has every production monitoring feature available across Arize.
would be inaccurate.
For this article, the comparison is specifically:
Langfuse
vs.
Phoenix
vs.
W&B Weave
not:
Langfuse
vs.
all Arize commercial products
Phoenix Uses OpenTelemetry and OpenInference
Phoenix receives traces through OpenTelemetry.
OpenInference defines AI-specific semantic conventions on top of observability concepts.
This lets instrumentation represent things such as:
LLM calls

retrievals

embeddings

tool invocations

agents

prompts
using a shared telemetry approach.
Architecture:
AI Application
      ↓
OpenInference instrumentation
      ↓
OpenTelemetry spans
      ↓
OTLP
      ↓
Phoenix
That standards-first approach is arguably Phoenix’s most important architectural advantage.
Basic Phoenix Instrumentation
A current Phoenix setup can initialize tracing with:
from phoenix.otel import register


tracer_provider = register(
    project_name="support-agent",
    auto_instrument=True,
)
With supported libraries installed, automatic instrumentation can capture model and framework activity.
Conceptually:
support_agent
│
├── LLM
├── retriever
├── tool
└── LLM
appears as an OpenTelemetry trace inside Phoenix.
Why OpenTelemetry Matters
Imagine your normal backend already emits:
HTTP spans

database spans

external API spans
through OpenTelemetry.
Your AI layer emits:
LLM spans

retrieval spans

tool spans
through OpenInference.
The long-term goal is a trace such as:
HTTP request
│
├── authentication
│
├── agent
│   ├── embedding
│   ├── vector retrieval
│   ├── tool
│   │   └── PostgreSQL
│   └── LLM generation
│
└── response
rather than completely separate observability systems for:
backend engineering

and

AI engineering
For general production tracing concepts, see:
Structured Logging and Monitoring: How to Debug Production Services in Cloud Environments
Phoenix Is Particularly Strong for RAG Diagnostics
RAG failures are frequently misunderstood.
When a model gives a wrong answer, the problem may not be the model.
The failure can occur in:
query generation

embedding

retrieval

reranking

context assembly

generation
Phoenix tracing makes it possible to inspect those stages separately.
For example:
User:
"What is our cancellation window?"

        ↓

Retriever
returned:
"Refund policy"
"Account deletion"
"Subscription upgrades"

        ↓

LLM
answered incorrectly
In that scenario:
changing the LLMmay do nothing.
The retrieval system is the real problem.
For vector-search architecture, see:
Pinecone vs Qdrant vs pgvector: Vector Database Comparison
Phoenix Evaluations
Phoenix supports both:
deterministic evaluators

LLM-as-a-judge evaluators
A deterministic evaluator might check:
def exact_match(output, expected):

    return output.strip() == expected.strip()
An LLM-based evaluator might instead assess:
groundedness

relevance

correctness

tool selection

instruction following
based on a rubric.
Phoenix can attach evaluation results to:
traces

datasets

experiments
which makes evaluation part of the same troubleshooting loop.
Phoenix Evaluators Are Themselves Traceable
This is an interesting feature.
An LLM-as-a-judge evaluator is still:
another LLM applicationand therefore can also behave incorrectly.
Phoenix traces evaluator executions themselves.
That means you can inspect:
judge input

judge prompt

model call

timing

score
rather than treating the evaluator as an unquestionable black box.
This becomes important when teams start relying heavily on:
LLM-as-a-judgefor quality gates.
An Evaluator Is Not Ground Truth
This applies to all three platforms.
Suppose your judge says:
Correctness = 0.94That does not prove the response is 94% correct.
The score reflects:
rubric

judge model

prompt

context

sampling

evaluation design
A good evaluation system should therefore be validated against human judgments.
A sensible process is:
Human-labelled sample
        ↓
Run evaluator
        ↓
Compare judge vs human
        ↓
Measure agreement
        ↓
Refine rubric
The observability platform makes evaluation easier.
It does not automatically make the evaluation correct.
Phoenix Datasets and Experiments
Phoenix supports creating datasets from observed examples.
A workflow might be:
Production traces
      ↓
Find failed queries
      ↓
Add to dataset
      ↓
Change prompt
      ↓
Run experiment
      ↓
Evaluate old vs new
This is the same broader quality loop that has become common across LLM engineering platforms.
Phoenix Prompt Playground
Phoenix includes prompt-oriented workflows such as:
Prompt Management

Prompt Playground

Span Replay

Prompts in Code
Span Replay is especially useful.
Suppose a production LLM call failed.
You can start from that actual invocation:
original messages

model

parameters

context
then ask:
Would this have worked with a different prompt or model?
Instead of constructing a synthetic example from scratch.
Phoenix Self-Hosting Is Straightforward
Phoenix can run locally.
For simple development:
Phoenix
+
SQLite
can be enough.
For production self-hosting, Phoenix supports PostgreSQL as its storage backend.
Conceptually:
AI Application
      ↓
OTLP
      ↓
Phoenix container
      ↓
PostgreSQL
Deployment options include:
Docker

Kubernetes

custom cloud environments
This makes Phoenix attractive when telemetry must remain in your own environment.
Phoenix Licensing Deserves Attention
Phoenix is publicly developed and Arize describes it as its open-source platform.
Its current distribution uses the Elastic License 2.0.
For most teams this may not create a problem.
However, if your organization has strict policies requiring:
OSI-approved licenses onlyor plans to redistribute or commercialize the software in unusual ways, legal teams should review the actual license instead of relying solely on the word “open-source.”
That is a general lesson for infrastructure selection:
Self-hostable and source-visible do not always mean identical licensing terms.
Where Phoenix Fits Best
Phoenix makes particular sense when you value:
OpenTelemetry

OpenInference

self-hosting

RAG troubleshooting

evaluation transparency

framework-neutral instrumentation

minimal vendor-specific telemetry
It is particularly attractive to engineers who already think in terms of:
spans

collectors

OTLP

instrumentation
rather than wanting a completely separate LLM telemetry model.
Weights & Biases Weave: GenAI Observability Inside the W&B Ecosystem
Weights & Biases has long been associated with traditional machine-learning experiment tracking.
Teams already use W&B for:
training runs

hyperparameters

datasets

artifacts

model versions

visualizations

reports
Weave extends that environment toward:
LLM applications

agents

traces

evaluations

scorers

datasets

production monitors

prompt experimentation
This means Weave’s biggest advantage may not be any single tracing feature.
It is the fact that GenAI observability can live beside an organization’s existing ML engineering workflow.
Weave Tracing Starts with Operations
In Weave, functions can be instrumented as operations.
A simple example:
import weave


weave.init(
    "support-agent"
)


@weave.op()
def retrieve_policy(
    query: str
):

    return search_index(
        query
    )


@weave.op()
def answer_question(
    question: str
):

    context = retrieve_policy(
        question
    )

    return call_model(
        question,
        context,
    )
Weave records calls to the decorated operations.
Conceptually:
answer_question
    ↓
retrieve_policy
    ↓
call_model
along with:
inputs

outputs

latency

nested operations

metadata
Weave Automatically Integrates With LLM Libraries
For supported model providers and frameworks, Weave can automatically trace LLM activity.
A typical setup starts with:
import weave


weave.init(
    "my-project"
)
then uses a supported SDK.
The goal is to minimize manual instrumentation around every model call.
Weave Also Supports OpenTelemetry
Weave can receive OpenTelemetry traces.
For example, integrations using OpenInference instrumentors can export OTLP spans into Weave.
Architecture:
Agent Framework
      ↓
OpenInference
      ↓
OpenTelemetry
      ↓
OTLP
      ↓
Weave
This is important because it prevents the W&B ecosystem from requiring every AI application to use only Weave-specific decorators.
Weave Is Strongly Connected to Versioned Objects
One of Weave’s useful ideas is that important AI engineering objects can be versioned.
That includes concepts such as:
datasets

models

prompts

operations
The basic goal is reproducibility.
Instead of saying:
We changed the system prompt sometime last week.
you want to know:
Prompt version
+
code version
+
dataset
+
evaluator
+
model
that produced a result.
This aligns naturally with W&B’s long history around experiment reproducibility.
Weave Datasets
A dataset can be created directly.
For example:
import weave


dataset = weave.Dataset(
    name="support-regression",

    rows=[
        {
            "question":
                "Can I change my address?",

            "expected":
                "Explain eligibility rules."
        },

        {
            "question":
                "Cancel order 183.",

            "expected":
                "Ask for confirmation."
        },
    ],
)
The dataset can then be saved and reused across evaluation runs.
That enables:
same examples
+
different models/prompts
+
same scorers
which is fundamental to meaningful regression testing.
Weave Evaluations
Weave’s evaluation API combines:
dataset

model or callable

scorers
For example:
import asyncio
import weave


weave.init(
    "support-agent"
)


@weave.op()
def support_model(
    question: str
):

    return {
        "answer":
            generate_answer(
                question
            )
    }


@weave.op()
def contains_answer(
    expected: str,
    model_output: dict,
):

    return {
        "match":
            expected.lower()
            in model_output[
                "answer"
            ].lower()
    }


evaluation = weave.Evaluation(

    dataset=[
        {
            "question":
                "What is the refund window?",

            "expected":
                "30 days",
        }
    ],

    scorers=[
        contains_answer
    ],
)


asyncio.run(
    evaluation.evaluate(
        support_model
    )
)
The important concept is:
Model output
      ↓
Scorer(s)
      ↓
Evaluation results
with the results preserved for comparison.
Weave Scorers Are Flexible
A scorer can be:
deterministic function

LLM-as-a-judge

built-in quality metric

custom evaluation logic
For example:
@weave.op()
def tool_selection_score(
    expected_tool: str,
    model_output: dict,
):

    return (
        model_output[
            "tool"
        ]
        ==
        expected_tool
    )
For other cases, an LLM judge may assess:
helpfulness

groundedness

safety

coherence

policy compliance
This makes Weave useful beyond standard ML metrics.
Weave Monitors Bring Evaluation Into Production
Offline evaluation answers:
Does the new version pass our test dataset?
Production monitoring asks:
Are live users still receiving good results?
Weave’s Monitor abstraction can apply scorers to incoming calls.
Conceptually:
Production call
      ↓
sampling rule
      ↓
scorer
      ↓
quality signal
Sampling is important because evaluating:
100% of production trafficwith another LLM can double or triple model cost depending on the workflow.
A monitor may instead evaluate:
5%

10%

50%
of relevant calls.
Evaluation Sampling Is a Cost-Control Mechanism
Suppose:
1,000,000 model requests/monthand each LLM-based evaluation costs:
$0.002Evaluating every request costs:
1,000,000 × $0.002
=
$2,000
A 10% sample costs approximately:
100,000 × $0.002
=
$200
before considering any additional evaluator tokens or provider pricing complexity.
The exact economics vary.
The principle does not:
Quality monitoring itself has a cost.
A production observability architecture should explicitly budget for it.
Weave’s Biggest Advantage: The Wider W&B Platform
Suppose a company already uses W&B to track:
model training

fine-tuning

datasets

checkpoints

artifacts

experiments
and now builds an LLM application.
Its lifecycle could become:
Training / fine-tuning
        ↓
W&B Models
        ↓
model artifact
        ↓
LLM application
        ↓
Weave traces
        ↓
Weave evaluations
        ↓
production monitor
That continuity can be much more valuable than selecting a separate best-of-breed tool for every stage.
Traditional ML + GenAI Is Where Weave Becomes Especially Interesting
Imagine a recommendation system that combines:
fine-tuned ranking model

vector retrieval

LLM explanation layer
The broader system contains both:
traditional MLand:
generative AIW&B already has a mature ecosystem for the first category.
Weave covers the second.
For organizations operating both, that unified engineering environment can simplify collaboration.
Weave Is Less About Self-Hosting as an OSS Product
This is an important difference from Langfuse and Phoenix.
Langfuse and Phoenix have clear self-hosting stories where teams run the application themselves.
W&B is primarily a managed enterprise platform.
Weights & Biases offers private/dedicated deployment options for qualifying enterprise environments, but that is not equivalent to downloading Weave as an independent open-source observability server and running it yourself in the same manner as Phoenix or Langfuse.
If:
self-host the complete observability control planeis a hard architectural requirement, that difference deserves significant weight.
Prompt Management: Langfuse vs. Phoenix vs. Weave
Prompts increasingly behave like deployable application artifacts.
A useful prompt platform should answer:
Who changed it?

What changed?

Which version is production?

Which model parameters were used?

How did quality change?

Can we roll back?
The three platforms approach this differently.
Langfuse
Prompt management is a first-class product area.
Strong capabilities include:
immutable versions

labels

production/staging promotion

prompt caching

prompt composition

playground

prompt-linked traces

experiments

quick rollback
This is probably the strongest prompt-release workflow of the three.
Phoenix
Phoenix provides:
Prompt Management

Prompt Playground

Prompt Hub

Span Replay

Prompts in Code
Its prompt experience is closely connected to:
observed failures
→ experimentation
which makes it particularly useful for investigating and improving problematic calls.
Weave
Weave supports prompt objects, versioned workflow components and Playground-based prompt/model iteration.
Its product identity, however, is less centered on:
central prompt deployment control planethan Langfuse.
Teams primarily seeking:
prompt versioning + controlled prompt releasesshould compare the exact workflow carefully rather than assuming all three platforms treat prompt deployment identically.
Agent Observability Is Becoming the Most Important Use Case
Simple LLM applications were:
Prompt
  ↓
Model
  ↓
Response
Modern agents look more like:
User
  ↓
Agent
  ↓
Plan
  ↓
Retriever
  ↓
Tool A
  ↓
Tool B
  ↓
Agent
  ↓
Tool C
  ↓
Final response
The number of possible failure points grows dramatically.
A Useful Agent Trace
Consider:
research_agent
│
├── classify_task
│
├── web_search
│
├── vector_retrieval
│
├── fetch_customer_data
│
├── calculator
│
└── generate_final_answer
For each step, you want to know:
input

output

duration

model

tokens

cost

status

metadata
When the final answer is wrong, you can inspect:
where the wrong state entered the workflowinstead of staring only at the final model response.
Tool Calls Need Their Own Evaluation
A tool call can be technically successful and semantically wrong.
Example:
{
  "tool": "refund_customer",
  "arguments": {
    "order_id": "18372"
  }
}
The API returns:
200 OKbut the user only asked:
Am I eligible for a refund?
The infrastructure succeeded.
The agent failed.
A useful evaluator may check:
correct tool selected

correct arguments

tool was necessary

destructive action required confirmation
LLM observability must operate above infrastructure observability.
Retrieval Should Also Be Evaluated Independently
Consider RAG:
Question
   ↓
Embedding
   ↓
Vector search
   ↓
Top 5 documents
   ↓
LLM
If retrieval is poor, evaluating only:
final answer correctnessdoes not tell you the root cause.
You also want metrics such as:
retrieval relevance

context precision

context recall

reranker quality
This is another reason trace-level evaluation matters.
For vector-database architecture, see:
Pinecone vs Qdrant vs pgvector: Vector Database Comparison
Cost Tracking Is Part of Observability
Model cost can change unexpectedly.
Suppose an agent originally executes:
1 embedding call

1 retrieval

2 LLM calls
After a workflow change:
1 embedding call

1 retrieval

8 LLM calls

3 tool retries
The feature might still work.
But cost per request may increase dramatically.
Observability should therefore track:
input tokens

output tokens

model

model-call count

latency

estimated cost
by:
feature

user

tenant

prompt version

agent version
where possible.
Cost Per Successful Task Is Better Than Cost Per Model Call
Suppose:
Model A
cost per call = $0.002
and:
Model B
cost per call = $0.010
Model A looks cheaper.
But if:
Model A
requires 5 retries
while:
Model B
solves task in one attempt
the actual application economics may reverse.
The meaningful metric is closer to:
AI cost
──────────────
successful task
rather than simply:
price per tokenAn observability platform can help connect those two layers.
OpenTelemetry Is Reducing Observability Lock-In
This is one of the most important industry trends.
A few years ago, every AI platform had its own:
trace SDK

trace schema

instrumentation callbacks

export format
That created significant switching cost.
OpenTelemetry changes the architecture.
Application
      ↓
OpenTelemetry instrumentation
      ↓
OTLP
      ↓
Collector
      ├── traditional observability
      └── AI observability
Phoenix is especially standards-oriented here.
Langfuse’s current tracing architecture is also based on OpenTelemetry.
Weave can receive OTel telemetry.
That makes it increasingly possible to separate:
instrumentationfrom:
observability backendOpenInference Adds AI Semantics
Generic OpenTelemetry understands:
span started

span ended

attributes

events
AI applications need semantics such as:
model name

LLM input

LLM output

retrieval documents

embedding

tool call

agent
OpenInference extends observability conventions for AI workloads.
Phoenix is deeply associated with OpenInference.
Other platforms can consume compatible telemetry through OpenTelemetry integrations.
This standards movement is worth considering when choosing a platform because telemetry often survives longer than the dashboard used to view it.
Do Not Put Sensitive Data Into Traces Without Thinking
AI traces can contain dramatically more sensitive information than ordinary infrastructure metrics.
A trace might include:
full user prompt

chat history

retrieved documents

customer record

internal policy

model output

tool arguments

database result
That means an LLM observability system can become one of the most sensitive data stores in your architecture.
Avoid Sending Secrets
Never intentionally trace:
passwords

JWTs

API keys

session cookies

private keys

database credentials

signed URLs
If your application already implements safe API patterns, retain those rules inside the tracing layer.
See:
Securing API Endpoints with JWT, CORS & Environment Variables
PII Requires a Deliberate Policy
Suppose the user writes:
My email is alex@example.com
and my account number is 938292.
If you trace the full prompt, that information now exists in:
application database

and

observability platform
Potentially with different:
retention

permissions

regions

deletion processes
Decide explicitly:
what should be captured

what should be masked

what should be excluded

how long traces should remain
before instrumenting production.
Self-Hosting Does Not Eliminate Security Work
A common assumption is:
self-hosted
=
secure
It does not.
Self-hosting transfers responsibility to you for:
authentication

network isolation

TLS

database backups

patching

availability

storage encryption

IAM

monitoring

retention

disaster recovery
For cloud deployment fundamentals, see:
Deploying Containerized Python & Express Apps to Google Cloud Run
A managed SaaS may actually have stronger operational controls than a poorly maintained internal installation.
Self-hosting is about control.
It is not automatically superior security.
The Self-Hosting Comparison
| Area | Langfuse | Phoenix | Weave |
|---|---|---|---|
| Local development | Yes | Yes | SDK/client workflows |
| Docker self-host | Yes | Yes | Not equivalent standalone OSS server |
| Kubernetes | Yes | Yes | Enterprise deployment model differs |
| PostgreSQL-backed production | Platform architecture dependent | Yes | Managed platform |
| Managed cloud available | Yes | Yes | Yes |
| Full control of telemetry store | Strong when self-hosted | Strong when self-hosted | Enterprise deployment dependent |
| Best for strict self-host requirement | Excellent | Excellent | Evaluate W&B enterprise deployment |
Pricing Models Need Careful Comparison
Comparing these platforms by:
monthly subscription pricealone is misleading.
Observability cost depends on:
trace volume

number of spans

payload size

retention

evaluation traffic

LLM judge usage

team size

enterprise features
Langfuse
Langfuse Cloud currently uses a combination of:
subscription tier

included usage

additional usage units
with different historical-data access and enterprise controls across plans.
Self-hosting changes the equation because you pay for:
your infrastructure

database

storage

operations
instead of only SaaS usage.
Phoenix
Phoenix itself can be self-hosted.
You therefore need to compare:
Phoenix infrastructure cost

vs.

Phoenix Cloud / broader Arize offerings
rather than assuming the OSS deployment is financially free.
Engineers still operate:
compute

PostgreSQL

storage

backups

upgrades
Weave
W&B’s pricing includes Weave data-ingestion allowances and broader platform plans.
That can make economic sense when the organization already pays for W&B’s larger ML platform.
If the only requirement is:
basic LLM tracingyou should still compare the cost against more narrowly focused platforms.
Don’t Forget LLM Judge Cost
Suppose the observability vendor itself costs:
$300/monthbut your production LLM-as-a-judge evaluation costs:
$1,500/monthThe evaluator is now the larger expense.
Always separate:
observability platform costfrom:
model evaluation costwhen forecasting production usage.
Production Sampling Strategy
A realistic production evaluation policy might be:
100% of errors

100% of user thumbs-down

100% of security-sensitive workflows

20% of new feature traffic

5% of normal successful traffic
rather than:
evaluate everythingSampling should reflect risk.
Build a Failure Dataset From Real Traffic
One of the highest-value practices across all three platforms is:
Turn production failures into permanent regression tests.
Suppose a customer query fails:
Can I return an item bought using store credit?After fixing the issue:
Add that input to dataset.Now the next prompt/model change must handle it correctly.
Over time:
Production failures
       ↓
Regression dataset
       ↓
Better evaluations
       ↓
Fewer repeated failures
This is how observability becomes an engineering feedback loop rather than a debugging dashboard.
Human Feedback Still Matters
LLM evaluators are useful.
User behavior is often better.
Useful signals include:
thumbs up/down

regenerate

user abandoned workflow

user corrected answer

escalation to human

task successfully completed
Suppose:
LLM judge score = 0.95but:
40% of users regenerate the answerThat discrepancy deserves investigation.
A mature quality system combines:
automated evaluations

human labels

real user behavior
rather than trusting one signal.
Offline and Online Evaluation Should Share the Same Metrics
Imagine development evaluates:
groundedness
correctness
tool selection
but production only tracks:
latencyYou cannot know whether deployment improved or degraded quality.
A better design:
Development
   ↓
correctness
groundedness
tool selection

Production
   ↓
correctness sample
groundedness sample
tool selection
The distributions can then be compared.
Evaluation Thresholds Need Baselines
Avoid arbitrary rules such as:
groundedness must be > 0.8without understanding the evaluator.
Instead:
Baseline model:
0.86

Candidate:
0.91
and:
Human agreement:
88%
provide more useful context.
LLM evaluation is measurement.
Measurement requires calibration.
CI/CD for LLM Applications
A strong deployment workflow might look like:
Pull Request
      ↓
Run dataset
      ↓
Execute candidate agent
      ↓
Run evaluators
      ↓
Compare baseline
      ↓
Pass thresholds
      ↓
Deploy
For example:
Correctness:
must not decrease > 2%

Tool selection:
must remain > 98%

Safety:
zero critical failures

p95 latency:
must remain < 4 seconds
This turns AI changes into testable engineering changes.
Prompt Changes Should Be Treated Like Software Changes
A one-line prompt modification can change:
tool usage

tone

policy compliance

output format

hallucination rate

token count
Therefore:
prompt changedshould trigger the same question as:
code changedDid the system still behave correctly?
Langfuse’s prompt release management is particularly strong for this.
Phoenix’s experiment workflow is strong for validating prompt changes from traced examples.
Weave can evaluate different prompt/model workflows against versioned datasets.
Observability for AI Coding Agents
The same concepts apply to coding agents such as:
Cursor

GitHub Copilot agents

Claude Code
A coding agent may:
read repository

search files

run commands

edit code

execute tests

open pull request
Observability for such systems should track:
task

agent steps

tool calls

command results

model calls

token use

completion outcome
For a deeper comparison of modern coding-agent environments, see:
Cursor vs GitHub Copilot vs Claude Code: AI Coding Tools Compared
What Should You Trace?
You do not necessarily need to capture every byte.
A useful trace normally contains enough information to understand:
what the user wanted

what the application decided

what external information it used

what tools it invoked

what model generated

how long it took

what it cost

whether it was good
A possible trace:
support_request
│
├── intent_classifier
│
│   └── model = ...
│
├── policy_retriever
│   ├── query
│   └── top_k documents
│
├── order_lookup
│   ├── order_id
│   └── status
│
└── final_generation
    ├── model
    ├── tokens
    ├── latency
    └── output
Sensitive values should still be redacted.
What Should You Evaluate?
Do not try to create one universal:
AI quality scoreQuality is multidimensional.
A support agent may need:
correctness

groundedness

policy compliance

helpfulness

tone

tool selection
A code agent may need:
tests passed

compilation

security

task completion

unnecessary diff size
A RAG system may need:
retrieval relevance

context recall

groundedness

answer correctness
The observability tool should support your evaluation framework rather than defining quality for you.
Platform Comparison by Use Case
| Use Case | Best Starting Point |
|---|---|
| Self-hosted LLM observability | Langfuse / Phoenix |
| Prompt lifecycle management | Langfuse |
| OpenTelemetry-first architecture | Phoenix |
| OpenInference ecosystem | Phoenix |
| Existing W&B ML organization | Weave |
| RAG debugging | Phoenix / Langfuse |
| Agent tracing | All three |
| Production prompt releases | Langfuse |
| ML + LLM unified workflow | Weave |
| Dataset experiments | All three |
| LLM-as-a-judge | All three |
| Trace-based regression datasets | All three |
| Local lightweight experimentation | Phoenix |
| Full LLM engineering control plane | Langfuse |
| Broad AI/ML lifecycle | Weave |
Which One Is Easiest to Start With?
For a developer wanting to instrument one application quickly:
all three are relatively approachablebecause each provides SDK-based instrumentation and integrations.
The real setup complexity appears later.
Questions become:
How do we manage prompts?

How do we define evals?

Who reviews failures?

How do datasets get curated?

How do we alert?

How long do traces remain?

How do we mask PII?

Who can access production traces?
Tool installation is easy.
Operationalizing LLM quality is the harder problem.
Which One Is Best for a Startup?
For a SaaS startup building an LLM-heavy product, I would evaluate:
Langfusevery seriously.
Why?
Because the startup likely needs:
tracing

prompt management

cost visibility

datasets

experiments

evaluation

self-hosting option
without introducing separate systems for every capability.
That does not mean Langfuse automatically wins.
If the engineering team is already strongly OpenTelemetry-oriented, Phoenix may fit better.
If the company already runs its ML organization on W&B, Weave can be the more coherent choice.
Which One Is Best for RAG Engineering?
I would give Phoenix particularly strong consideration.
RAG debugging benefits enormously from:
OpenInference instrumentation

retriever traces

evaluation

datasets

experiments

span replay
and Phoenix’s tooling is clearly designed around this workflow.
Langfuse is also very capable here and may win when prompt management and broader production workflow matter more.
Which One Is Best for Prompt-Heavy Applications?
Langfuse.
If your application behavior depends heavily on:
dozens or hundreds of managed prompts

staging/production versions

prompt rollbacks

product-manager editing

prompt A/B testing

prompt-specific metrics
Langfuse’s prompt management is a meaningful differentiator.
Which One Is Best for Existing ML Teams?
Weave deserves a close look when the company already uses Weights & Biases.
If the stack already contains:
W&B Models

Artifacts

Tables

Registry

Reports
adding Weave can create a much more unified workflow than introducing an isolated LLM observability platform.
That organizational integration can matter more than a small feature difference.
Which One Is Best for Strict Open Telemetry Architecture?
Phoenix.
Its architecture and OpenInference ecosystem are strongly aligned with:
OpenTelemetry instrumentationand OTLP.
This makes it attractive if you want telemetry that can participate in a larger observability architecture.
Langfuse has also moved strongly toward OpenTelemetry and should absolutely be considered in the same discussion.
Which One Is Best for Self-Hosting?
The practical shortlist is:
Langfuse

Phoenix
Both have explicit self-hosting models.
The better choice depends on whether you value:
integrated prompt/application lifecyclemore strongly:
→ Langfuseor:
standards-first tracing/evaluationmore strongly:
→ PhoenixA Production Architecture With Langfuse
Users
  ↓
Application API
  ↓
AI Agent
  ├── Vector DB
  ├── Tools
  └── LLM
       │
       ▼
   Langfuse
       │
       ├── Traces
       ├── Sessions
       ├── Cost
       ├── Prompts
       ├── Scores
       ├── Datasets
       └── Experiments
This architecture works well when Langfuse becomes the central AI engineering control plane.
A Production Architecture With Phoenix
Users
  ↓
Application
  ↓
OpenInference Instrumentation
  ↓
OpenTelemetry
  ↓
Phoenix
  │
  ├── Traces
  ├── Evaluations
  ├── Datasets
  ├── Experiments
  └── Prompt tooling
This architecture emphasizes standards-based telemetry.
A Production Architecture With Weave
Users
  ↓
AI Application
  ↓
Weave SDK / OTEL
  ↓
W&B Weave
  │
  ├── Traces
  ├── Scorers
  ├── Datasets
  ├── Evaluations
  ├── Monitors
  └── Playground
          │
          ▼
      Wider W&B
          │
          ├── Models
          ├── Artifacts
          ├── Registry
          └── Reports
This architecture is particularly compelling when GenAI is only one part of a broader ML platform.
Avoid Building Three Separate Systems Unless You Need Them
A common engineering mistake is to combine:
Tool A for traces

Tool B for evals

Tool C for prompts

Tool D for datasets
before the team has enough scale to justify the complexity.
Every integration introduces:
authentication

data synchronization

SDKs

permissions

billing

retention

security review
Start with the smallest coherent platform that solves the real workflow.
Split components later when a specific limitation becomes measurable.
Don’t Treat Observability as a Dashboard Project
Installing one of these platforms does not make the AI application observable.
You still need to decide:
what constitutes a trace

which spans matter

which metadata is useful

what is sensitive

which quality metrics matter

which examples enter regression datasets

which failures trigger alerts
The hard part is not:
pip install ...The hard part is defining what “good” means for your application.
A Practical Implementation Roadmap
For a new AI application, I would implement observability in stages.
Stage 1 — Trace
Capture:
model calls

retrievals

tools

latency

tokens

errors
Stage 2 — Add Context
Add:
session

user/tenant

feature

environment

model version

prompt version
Stage 3 — Add Feedback
Capture:
thumbs up/down

task success

manual labels
Stage 4 — Build Dataset
Turn important production examples into:
regression casesStage 5 — Add Evals
Start with a small number of meaningful metrics.
For example:
correctness

groundedness

tool selection
Stage 6 — Experiment
Compare:
model

prompt

retriever

chunking

agent logic
against the same dataset.
Stage 7 — Production Monitoring
Sample live traffic and watch:
quality

cost

latency

failure rate
Stage 8 — CI Quality Gates
Prevent known regressions from shipping.
That progression is much healthier than configuring twenty evaluators on day one.
Production Checklist
| Area | Question |
|---|---|
| Trace coverage | Can we see every major agent step? |
| Sessions | Can we follow multi-turn conversations? |
| Retrieval | Can we inspect retrieved context? |
| Tools | Can we see tool names, arguments and outcomes? |
| Model calls | Can we identify model/version? |
| Prompt | Can we identify prompt version? |
| Tokens | Are input/output tokens visible? |
| Cost | Can cost be attributed by feature/user? |
| Latency | Can we find slow steps? |
| Errors | Are failed operations visible? |
| User feedback | Can real feedback attach to traces? |
| Dataset | Can failures become test cases? |
| Evals | Can we run deterministic and LLM judges? |
| Experiments | Can we compare versions consistently? |
| PII | Is sensitive data masked or excluded? |
| Retention | Is trace retention deliberate? |
| Access | Are production traces appropriately restricted? |
| Self-host | Is it required? |
| Alerts | Can meaningful production regressions be surfaced? |
| Export | Can data leave the platform if needed? |
My Practical Decision Framework
I would make the choice using five questions.
1. Do We Need Central Prompt Management?
If strongly yes:
Langfusemoves to the top of the list.
2. Is OpenTelemetry/OpenInference Standardization Critical?
If yes:
Phoenixdeserves serious consideration.
3. Are We Already a W&B Organization?
If yes:
Weavemay create the simplest overall AI engineering architecture.
4. Must We Self-Host the Complete Platform?
If yes:
Langfuse

or

Phoenix
are the natural starting points.
5. Is Traditional ML Part of the Same Platform?
If yes:
Weavehas a structural advantage through the broader W&B ecosystem.
Final Comparison
Choose Langfuse When You Want an LLM Engineering Platform
Langfuse is strongest when you want one place for:
tracing

sessions

prompt management

evaluation

datasets

experiments

cost tracking

production monitoring
Its particularly strong differentiator is the integration between:
prompt lifecycle
+
production traces
+
evaluation
For many standalone LLM SaaS applications, it is probably the most complete all-around starting point.
Choose Phoenix When You Want Standards-First AI Observability
Phoenix is strongest when you care deeply about:
OpenTelemetry

OpenInference

transparent traces

RAG diagnostics

evaluation

self-hosting

portable instrumentation
It is particularly attractive to engineering teams that want AI observability to look like an extension of normal distributed tracing rather than an entirely separate telemetry universe.
Choose Weave When Your AI Stack Is Bigger Than LLMs
Weave is strongest when your organization already thinks in terms of:
datasets

models

experiments

artifacts

evaluation

production AI
across traditional ML and GenAI.
If W&B already acts as the engineering system around model development, Weave can naturally extend that environment into agent and LLM observability.
There Is No Universal Winner
For a new LLM-first SaaS product, my shortlist would often begin with:
Langfuse
vs.
Phoenix
especially when self-hosting or platform openness matters.
For a mature ML organization already invested in Weights & Biases:
Weavemay be the most coherent answer.
The more important principle is not which dashboard looks better.
It is whether the platform helps your team complete this loop:
Observe failure
      ↓
Understand root cause
      ↓
Capture example
      ↓
Change system
      ↓
Evaluate change
      ↓
Compare against baseline
      ↓
Deploy safely
      ↓
Measure production again
That loop is what turns LLM observability from:
"we can see model calls"into:
"we can systematically improve the AI product."That is the capability worth buying.
Official Documentation and Technical References
Langfuse
Langfuse Prompt Version Control
Langfuse API and Data Platform
Arize Phoenix
Phoenix OpenTelemetry Tracing Setup