
Updated October 2026
For more than two decades, business intelligence has followed a familiar pattern.
Companies collect data.
Data engineers prepare it.
Analysts query it.
BI developers build dashboards.
Business leaders open those dashboards to understand what happened.
Then someone notices something unusual:
Why did revenue fall?
Why did customer retention decline?
Why did conversion suddenly change?
At that point, the dashboard often stops being the answer.
An analyst begins another process.
They identify the right datasets, check metric definitions, write SQL, compare segments, test possible explanations, create additional charts, validate the results, and finally explain what happened.
That second part—investigation—is where much of the real analytical work happens.
And it is increasingly becoming a target for AI.
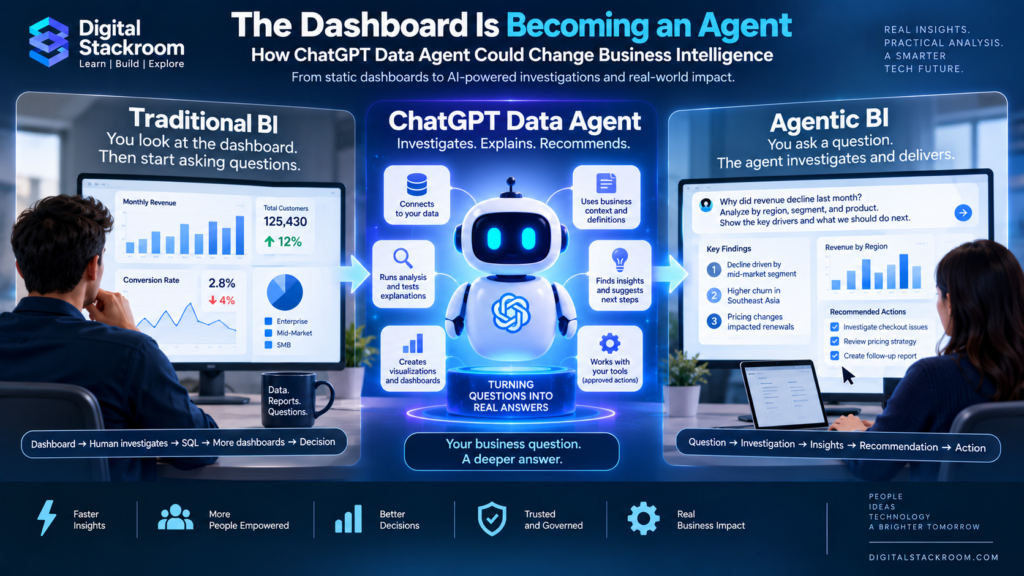
On September 10, 2026, OpenAI introduced the Data agent in ChatGPT Work. The Data plugin can connect to approved enterprise data sources and business context, investigate business questions, create interactive dashboards and reports, work with existing BI platforms, and help move from findings toward approved actions.
The important development is not simply that ChatGPT can build charts.
We already have many tools that can build charts.
The bigger shift is this:
Business intelligence is beginning to move from displaying predefined information toward actively investigating questions.
Traditional BI often asks:
What does the dashboard show?
Agentic BI can increasingly ask:
What changed, why did it change, what evidence supports the explanation, and what should we investigate next?
That difference could reshape how organizations use dashboards, analysts, semantic layers, data warehouses, and BI platforms.
The dashboard is not disappearing.
But it may no longer be the only intelligent interface sitting between people and their data.
The Short Answer
Traditional BI usually follows this pattern:
Data → Dashboard → Human notices something → Analyst investigates → Explanation
Agentic analytics moves closer to:
Business question → AI investigation → Data queries → Evidence → Visualization → Explanation → Recommendation
A traditional dashboard is designed around questions someone anticipated in advance.
A data agent can begin with a question nobody thought to build into the dashboard.
For example:
“Why did enterprise customer retention decline last month? Compare geography, customer segment, product usage, support activity, pricing, and renewal behavior. Show the evidence behind the strongest drivers.”
That request may require several datasets, multiple comparisons, and a sequence of analytical decisions.
The significance of the Data agent is therefore not natural-language querying alone.
It is the attempt to automate more of the analytical investigation loop.
Table of Contents
What OpenAI Actually Launched
OpenAI’s Data plugin is designed to work with connected business data and the context organizations already use to understand that data.
Supported sources include data platforms such as:
- Amazon Redshift
- ClickHouse
- Databricks
- Google BigQuery
- MongoDB
- Snowflake
The system can also use documents and files from connected services such as Google Drive and SharePoint.
This matters because business analysis rarely depends on database tables alone.
A question such as:
“Why is customer retention declining?”
may require:
- transaction data
- product usage information
- customer segments
- documented metric definitions
- historical reports
- operational context
- existing dashboards
OpenAI also emphasizes the importance of the organization’s own business definitions.
The Data plugin can use semantic layers, documentation, established calculations, dataset relationships, and trusted dashboards to interpret what business terms actually mean.
That is critical.
A language model cannot safely invent the definition of:
active customer
qualified opportunity
churn
contribution margin
monthly recurring revenue
Those definitions vary from organization to organization.
The architecture for reliable AI analytics is therefore not:
LLM + database
It is closer to:
LLM + governed data + semantic definitions + business context + permissions
That distinction may determine whether enterprise data agents become genuinely useful or simply generate convincing-looking mistakes.
Why Text-to-SQL Is Not the Real Breakthrough
Natural-language SQL generation has existed for years.
A system that converts:
“Show revenue by region.”
into:
SELECT region, SUM(revenue) ...
is useful.
But it is not the hardest part of analytics.
Real stakeholders rarely arrive with perfectly defined analytical specifications.
They say:
“Revenue looks bad. What happened?”
A good analyst then has to determine:
- Which period should be compared?
- Is the decline real or caused by incomplete data?
- Is it one geography or global?
- Did price change?
- Did volume change?
- Did customer mix change?
- Was acquisition lower?
- Did churn increase?
- Did one product behave differently?
- Did a tracking issue distort the metric?
That is not query generation.
That is investigation.
The analyst is turning an ambiguous business question into a sequence of testable analytical questions.
Agentic analytics becomes interesting when AI can participate in that process.
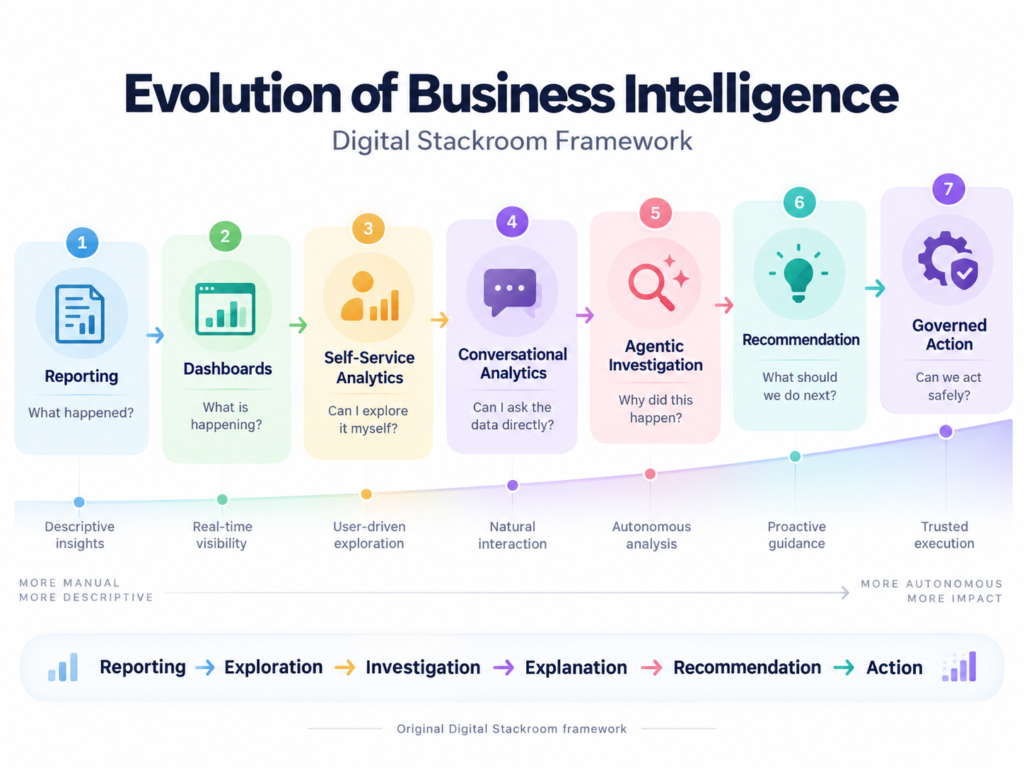
Digital Stackroom Framework: The Evolution of Business Intelligence
A useful way to understand this shift is to view BI as a progression.
Stage 1 — Reporting
Primary question:
What happened?
The output is usually a static report.
Stage 2 — Dashboards
Primary question:
What is happening?
Interactive dashboards provide recurring KPIs, filters, and visualizations.
Stage 3 — Self-Service Analytics
Primary question:
Can I explore the data myself?
Business users gain access to filters, dimensions, pivoting, and visualization tools.
Stage 4 — Conversational Analytics
Primary question:
Can I ask the data directly?
Users express analytical questions in natural language.
Stage 5 — Agentic Investigation
Primary question:
Why did this happen?
The AI performs several analytical steps rather than executing one query.
Stage 6 — Recommendation
Primary question:
What should we investigate or do next?
The system synthesizes evidence and proposes next steps.
Stage 7 — Governed Action
Primary question:
Can we act on the finding safely?
Analytics connects to operational systems under appropriate permissions and approvals.
The broader progression becomes:
Reporting → Exploration → Investigation → Explanation → Recommendation → Action
That is much more significant than replacing SQL syntax with English.
Traditional BI vs Agentic BI
| Capability | Traditional BI | Agentic BI |
|---|---|---|
| Primary interaction | Dashboard | Question or goal |
| Questions | Usually anticipated | Can be ad hoc |
| Investigation | Human-led | Agent-assisted |
| SQL | Usually analyst-written | Can be agent-generated |
| Visualizations | Usually predefined | Can be generated dynamically |
| Follow-up analysis | Often requires new work | Conversational |
| Root-cause exploration | Analyst-driven | Multi-step agent-assisted |
| Business definitions | Important | Even more important |
| Recommendations | Mostly human | AI can propose |
| Operational action | Separate workflow | Can connect to governed actions |
| Human role | Analyze and interpret | Validate, govern, investigate and decide |
The key distinction is not that AI removes BI.
It changes who performs the intermediate analytical work.
A Dashboard Answers a Question Someone Already Thought Of
Suppose an executive dashboard contains:
- revenue
- conversion
- active users
- churn
- average order value
- customer acquisition cost
Those metrics exist because someone anticipated that decision-makers would need them.
Now imagine the CEO asks:
“Why are mid-market customers in Southeast Asia renewing at a lower rate even though their product usage increased?”
No existing dashboard may answer that.
The question could require:
- regional analysis
- customer segmentation
- renewal events
- feature usage
- support interactions
- pricing history
- contract changes
- historical cohorts
Traditional workflow:
Question
↓
Analytics request
↓
Identify datasets
↓
Write and validate queries
↓
Analyze dimensions
↓
Create visualizations
↓
Explain findings
Agentic analytics attempts to compress parts of that loop.
The AI does not simply retrieve an existing answer.
It helps construct the investigation required to reach one.
A Practical Example: Why Did Revenue Fall?
Imagine monthly revenue falls by 8%.
A traditional dashboard tells the business:
Revenue: ↓ 8%
Useful—but incomplete.
Leadership now wants to know why.
A human analyst might investigate:
Revenue
↓
Geography
↓
Product
↓
Customer segment
↓
New vs existing customers
↓
Volume
↓
Price
↓
Retention
↓
Potential drivers
The process may require many queries and several rounds of discussion.
With an analytical agent, the manager could instead ask:
“Revenue declined 8% last month. Investigate the major drivers. Compare geography, product, customer segment, new versus existing customers, pricing, transaction volume, and churn. Show the evidence supporting each important conclusion.”
The agent could then attempt to:
understand the metric
↓
identify relevant sources
↓
establish the baseline
↓
compare periods
↓
decompose the metric
↓
test segments
↓
identify candidate drivers
↓
create visual evidence
↓
explain findings
↓
recommend further checks
This is much closer to analytical work than simple text-to-SQL.
Digital Stackroom Analytical Investigation Loop
A trustworthy data agent should not simply produce an answer.
It should follow a disciplined analytical process.
1. Clarify
Define:
- metric
- population
- timeframe
- comparison
- objective
2. Establish the Baseline
Confirm that the claimed change actually exists.
For example:
Revenue declined 8.2% month over month.
3. Decompose
Break the metric into logical drivers.
For example:
Revenue = Customers × Purchase Frequency × Average Order Value
4. Segment
Examine relevant dimensions such as:
- geography
- product
- channel
- customer type
- device
- acquisition source
5. Investigate
Determine where the largest or most unusual changes occurred.
6. Validate
Check:
- source completeness
- metric definitions
- filters
- joins
- anomalies
- historical patterns
- comparison logic
7. Explain
Separate:
evidence
from:
interpretation
The system should make clear what the data proves and what remains a hypothesis.
8. Recommend
Suggest the next analytical or operational steps.
This is a much better model for AI analytics than simply asking a language model to “analyze the data.”
Why the Semantic Layer Becomes More Important
Consider the request:
“Show active customers.”
What does active mean?
Possibilities include:
- logged in during the last 30 days
- completed a purchase
- has an active paid subscription
- used a core feature
- generated revenue during the quarter
All are plausible.
Only one may match the company’s official definition.
This is why semantic layers become increasingly important in agentic BI.
The analytical agent needs access to authoritative information about:
- metrics
- calculations
- relationships
- business entities
- approved queries
- naming conventions
Without this context, an AI system can produce technically valid queries that answer the wrong business question.
The better AI becomes at generating analysis, the more important trustworthy definitions become.
Question First, Dashboard Second
One of the most interesting features of the Data agent is its ability to turn analysis into an interactive dashboard.
Users can specify metrics, comparisons, breakdowns, and visual requirements, then refine the dashboard conversationally.
This reverses the traditional relationship between dashboards and questions.
Historically:
Build dashboard → user explores dashboard → user asks questions
Agentic analytics allows:
Ask question → investigate → generate dashboard from findings
This means dashboards may increasingly become outputs of analysis rather than always being the starting point.
That could reduce the need to permanently build a dashboard for every possible analytical question.
The Dashboard May Become a Temporary Artifact
Organizations often accumulate hundreds or thousands of dashboards.
Over time, many become:
- unused
- duplicated
- outdated
- poorly maintained
- difficult to discover
Agentic analytics changes the economics of dashboard creation.
Consider:
“Create a view comparing this product launch with our previous three launches.”
The dashboard may only need to exist for a few weeks.
Instead of creating a permanent BI asset, the organization could generate an analytical workspace when the need arises.
This does not eliminate permanent dashboards.
It creates another category:
temporary, question-specific analytical views.
That may shift some organizations from maintaining enormous dashboard inventories toward a combination of:
stable monitoring dashboards + on-demand investigative views
Dashboards Monitor. Agents Investigate.
This may be the simplest framework for understanding the emerging relationship.
Dashboard
Best suited for:
“How are we doing?”
Dashboards are excellent for recurring metrics, operational monitoring, executive scorecards, regulatory reporting, and shared organizational visibility.
Data Agent
Best suited for:
“Why did this change?”
Agents are useful when the question requires exploration, comparison, decomposition, or investigation.
The technologies are complementary.
A dashboard monitors known questions.
An agent helps investigate unknown ones.
Existing BI Platforms Still Matter
OpenAI’s current approach is notable because the Data plugin can work with established BI systems including platforms such as:
- Power BI
- Tableau
- Sigma
- ThoughtSpot
- Omni
- Oracle BI
That is an important signal.
The near-term future is unlikely to be:
ChatGPT replaces every BI platform.
A more realistic architecture is:
AI becomes another analytical interface
while existing platforms continue providing:
- semantic models
- governed metrics
- dashboards
- access controls
- visualization capabilities
- distribution
- enterprise governance
Agentic analytics may therefore sit above or beside the existing BI stack rather than immediately replacing it.
Google and Tableau Are Moving in the Same Direction
OpenAI is not alone in this transition.
Google made Conversational Analytics in BigQuery generally available in June 2026. Google describes it as allowing business and technical users to query data using natural language, perform multi-step analysis, and generate visual reports directly against governed BigQuery data.
Tableau is also explicitly positioning its platform around agentic analytics, with conversational analysis, monitoring, trusted business knowledge, and the ability to connect insights more closely to decisions and actions.
The implementations differ.
But the broader direction is similar:
Data → reasoning → insight → action
Business intelligence is becoming less passive.
From Passive BI to Active BI
Traditional dashboards usually wait for someone to look at them.
Imagine an operational metric deteriorates.
The traditional pattern may be:
Metric changes
↓
Dashboard updates
↓
Someone eventually notices
↓
Analyst investigates
↓
Team responds
Agentic analytics creates the possibility of:
Metric changes
↓
Anomaly is detected
↓
Agent investigates
↓
Likely driver identified
↓
Evidence summarized
↓
Relevant team alerted
↓
Human reviews recommended response
The difference is important.
The analytics system begins participating in the workflow rather than simply displaying information.
The Role of Analysts Will Change
The most immediate effect of data agents may not be eliminating analysts.
It may be reducing the volume of routine analytical requests reaching them.
Examples include:
“Show sales by region.”
“Compare this month with last month.”
“How many customers cancelled?”
“Build a basic pipeline dashboard.”
Automating more of this work could allow analysts to spend more time on:
- strategic analysis
- experimental design
- forecasting
- causal questions
- data quality
- metric design
- complex investigations
- decision support
The role moves away from being primarily a query service.
SQL Still Matters
AI may reduce how much SQL analysts manually type.
That does not make SQL knowledge less important.
Generated analysis can still contain:
- incorrect joins
- duplicate rows
- wrong filters
- incorrect aggregations
- broken date logic
- missing partitions
- data leakage
- misunderstood grain
Someone who understands SQL can inspect and challenge generated analysis.
Someone who does not may accept incorrect conclusions because the output looks polished.
Agentic analytics therefore changes the skill requirement from:
Can you write the query?
toward:
Can you verify whether this analysis is actually correct?
Verification May Become the New Bottleneck
AI can accelerate analytical creation.
But faster creation increases the amount of output requiring validation.
A reviewer should be able to ask:
- Which datasets were used?
- Which metric definition was applied?
- What timeframe was selected?
- What filters were applied?
- What queries were generated?
- Did joins change the grain?
- Were null values handled correctly?
- Was the baseline appropriate?
- Is the conclusion supported by evidence?
As analytical generation becomes easier, verification becomes more important.
The bottleneck may gradually move from:
creating analysis
toward:
trusting analysis
The Biggest Risk: Confidently Wrong Analysis
A wrong chart is dangerous.
A wrong analytical agent may be more dangerous because it can also provide a persuasive explanation.
Imagine the system concludes:
“Customer churn increased because of the recent pricing change.”
The real cause might be:
a broken tracking pipeline.
The explanation may still look logical.
The chart may look professional.
Leadership may act on it.
This is why agentic analytics needs stronger controls than ordinary conversational AI.
Digital Stackroom Framework: Five Layers of Trustworthy Agentic BI
A trustworthy agentic analytics system should have five layers.
Layer 1 — Trusted Data
The underlying data must be accurate, current, reliable, and governed.
Layer 2 — Trusted Definitions
Metrics and business concepts need authoritative definitions.
Layer 3 — Trusted Analysis
Queries, filters, assumptions, and supporting evidence should be inspectable.
Layer 4 — Trusted Access
The system must enforce appropriate data permissions.
Layer 5 — Trusted Action
Consequential actions should be governed by approvals and policy controls.
The architecture can be represented as:
Trusted Data
↓
Trusted Definitions
↓
Trusted Analysis
↓
Trusted Access
↓
Trusted Action
If the foundation is weak, AI does not repair it.
It can amplify the weakness.
Existing Permissions Still Matter
OpenAI says administrators control which connections are available and who can use them.
Queries use the connected account’s existing permissions, including applicable table, row, and column restrictions.
That is essential.
A user should not gain access to sensitive finance or HR data simply because the Data plugin can connect to the same warehouse.
Agentic analytics therefore does not eliminate traditional access management.
It makes access management even more important.
Sharing Creates Another Governance Layer
There is another important issue: analytical outputs themselves may contain sensitive information.
OpenAI’s documentation notes that when a generated dashboard is published through OpenAI Sites, data used in the analysis can be copied into the published site.
That means governance needs to answer two different questions:
Who can access the original data?
and:
Who can access the resulting analysis?
These are not always the same thing.
Organizations therefore need controls around:
- source permissions
- generated reports
- dashboards
- exported artifacts
- publication
- sharing destinations
Agentic BI extends data governance beyond querying.
Should Data Agents Be Allowed to Take Actions?
Eventually, yes—for selected workflows.
But analytical access and execution authority should not automatically be treated as the same permission.
A useful risk model is:
Low Risk
Potentially automate:
- refresh a dashboard
- create an internal report
- generate a summary
- send a routine internal notification
Medium Risk
Require review or approval:
- update CRM information
- create a support case
- modify a campaign
- send external communication
High Risk
Require strong human authorization:
- change pricing
- approve payments
- delete business data
- modify production systems
- change sensitive permissions
The closer analytics moves toward action, the stronger governance needs to become.
Analytics and Automation Are Converging
Historically:
Analytics tells you what happened.
Automation:
does something about it.
Agentic systems can connect the two.
Consider:
Support complaints increase
↓
Data agent investigates
↓
Finds complaints concentrated in one product version
↓
Creates incident summary
↓
Relevant team reviews finding
↓
Incident is opened
↓
Engineering is notified
↓
Metric is monitored after the fix
This combines:
analytics + reasoning + workflow automation
That is why agentic BI may eventually become part of a broader operational system.
The Future Analytics Stack
A simplified traditional analytics stack looks like:
Data Sources
↓
Warehouse / Lakehouse
↓
Transformation
↓
Semantic Layer
↓
BI Platform
↓
Dashboard
↓
Human
A more agentic architecture could become:
Data Sources
↓
Warehouse / Lakehouse
↓
Transformation
↓
Semantic Layer
↓
Data Agent
- query
- compare
- investigate
- validate
- explain
- visualize
↓
Human Decision
↓
Governed Actions
The data agent does not replace the data stack.
It becomes another layer operating on top of it.
Data Quality Becomes More Valuable, Not Less
When enterprise data is accessible only to a small analytics team, inconsistencies may sometimes be resolved manually.
When thousands of employees can ask questions directly, those inconsistencies scale.
Suppose:
customer
means one thing in Finance and another in Marketing.
Or:
revenue
uses different exclusion rules across two dashboards.
An AI system needs to know which definition is authoritative.
The organizations best prepared for agentic BI may therefore be those with:
- clean data
- strong metadata
- documented definitions
- reliable pipelines
- governed semantic layers
- clear ownership
AI increases the value of good data infrastructure.
What Happens to BI Developers?
BI development is unlikely to disappear.
But the highest-value work may shift.
Instead of building endless variations of dashboards, BI professionals may spend more time designing:
- semantic models
- governed metrics
- reusable analytical products
- security policies
- certified queries
- agent instructions
- monitoring
- visualization standards
- quality controls
The role moves from:
dashboard builder
toward:
analytics-system architect
What Happens to Data Engineers?
Agentic BI does not remove data engineering.
It makes reliable data engineering more visible.
If hundreds or thousands of users can interrogate enterprise data conversationally, pipelines must be:
- reliable
- performant
- documented
- discoverable
- governed
Poorly documented or inconsistent datasets that analysts previously worked around manually become much harder to hide.
Data engineers become increasingly responsible for building an environment that humans and agents can both understand safely.
What Analysts Should Learn Now
SQL remains valuable.
Python remains valuable.
Statistics remains valuable.
But analysts should increasingly develop skills in:
- metric design
- semantic modeling
- AI verification
- experimental thinking
- causal reasoning
- data storytelling
- uncertainty communication
- agent supervision
The strongest analyst may not be the person who types queries fastest.
It may be the person who can transform an ambiguous business problem into a trustworthy analytical process.
The Data-Agent Request Framework
The quality of agentic analysis still depends heavily on the quality of the request.
A useful structure is:
Question
What are we trying to understand?
Metric
Which business measure matters?
Population
Which customers, users, orders, or entities?
Time
Which period?
Comparison
Against what baseline?
Dimensions
Which breakdowns should be tested?
Evidence
What must support the conclusion?
Uncertainty
What should the system flag rather than guess?
Output
Dashboard, table, report, or recommendation?
Instead of:
“Analyze conversion.”
a stronger request would be:
“Investigate why checkout conversion for US web customers declined during the last 14 days compared with the previous 14 days. Compare browser, device, channel, and product. Show the data and definitions used, flag low-volume segments, and produce an executive summary with supporting charts.”
That is not merely prompt engineering.
It is analytical specification.
A Practical Adoption Roadmap
Organizations should not begin by giving an AI agent access to every data source and operational system.
A more responsible progression is:
Phase 1 — Low-Risk Exploration
Start with:
- sample datasets
- non-sensitive information
- read-only access
Measure analytical accuracy.
Phase 2 — Trusted Metrics
Add:
- semantic layers
- certified metrics
- validated queries
- documented definitions
Phase 3 — Business Self-Service
Allow selected business teams to answer routine questions.
Monitor usage and correctness.
Phase 4 — Agentic Investigation
Introduce:
- multi-step analysis
- root-cause exploration
- anomaly investigation
- dynamic dashboards
Phase 5 — Controlled Actions
Connect insights to operational systems using explicit approvals and policy controls.
The objective should not be:
“Give AI access to everything.”
It should be:
“Increase analytical autonomy without losing trust.”
How Should Companies Measure Success?
Counting prompts is not enough.
Organizations should measure outcomes.
| Metric | What It Measures |
|---|---|
| Time to insight | Is analysis becoming faster? |
| Analyst backlog | Are routine requests decreasing? |
| Query accuracy | Are generated analyses correct? |
| Metric consistency | Are business definitions respected? |
| Human correction rate | How often does analysis need fixing? |
| Investigation depth | Are users performing meaningful analysis? |
| Dashboard reuse | Are generated outputs useful? |
| Decision latency | Are teams reaching decisions faster? |
| Cost per analysis | Is the approach economically useful? |
| User trust | Do employees actually rely on the system? |
A successful data agent should reduce the distance between:
business question
and:
trusted decision
—not simply generate more charts.
The Emerging Battle for the Analytics Interface
There are at least three broad approaches to agentic analytics.
Warehouse-First
The agent lives close to the governed data platform.
BigQuery Conversational Analytics is one example.
Advantages can include proximity to data, warehouse governance, and existing data infrastructure.
BI-First
The agent lives close to dashboards, semantic models, and established BI workflows.
Tableau represents this direction.
The strength is access to governed analytical knowledge and mature visualization infrastructure.
AI-Workspace-First
The analytical agent lives inside a general AI work environment and connects outward to data platforms and BI tools.
ChatGPT Data is an example of this approach.
Its advantage is that analysis can potentially connect naturally into other forms of work such as:
investigation
↓
dashboard
↓
executive summary
↓
communication
↓
follow-up tasks
Each approach has advantages.
The enterprise analytics stack may ultimately use several of them together.
Will ChatGPT Data Replace Power BI or Tableau?
There is not enough evidence to conclude that established BI platforms are about to disappear.
In fact, OpenAI’s support for BI integrations suggests the opposite.
Dedicated BI platforms still provide mature capabilities in:
- semantic modeling
- governed metrics
- dashboard distribution
- visualization
- access controls
- performance optimization
- enterprise reporting
A more likely near-term architecture is:
data platform
semantic layer
BI platform
AI analytical agent
The interface may change faster than the infrastructure underneath it.
Will Data Agents Replace Analysts?
They will probably automate parts of analytical work.
That is different from replacing analytical expertise.
AI can help with:
- routine queries
- common comparisons
- first-pass investigation
- visualization
- dashboard creation
- summarization
Humans remain especially important for:
- defining meaningful metrics
- validating assumptions
- understanding business context
- causal reasoning
- experimental design
- recognizing bad data
- communicating uncertainty
- making consequential decisions
Agentic analytics makes analytical judgment more important because automation increases the amount of analysis that can be produced.
The Bigger Shift: From Business Intelligence to Decision Intelligence
Traditional BI is primarily concerned with understanding the business.
Agentic systems push analytics closer to deciding what should happen next.
The progression becomes:
Data
↓
Information
↓
Insight
↓
Explanation
↓
Recommendation
↓
Action
Each step increases potential value.
Each step also increases potential risk.
A mistaken chart is problematic.
A mistaken recommendation is more serious.
A mistaken automated action can become operationally damaging.
Governance therefore has to become stronger as analytical systems gain more autonomy.
Will Dashboards Disappear?
No.
Dashboards remain extremely useful for:
- recurring KPIs
- executive scorecards
- operational monitoring
- shared organizational views
- regulatory reporting
- performance tracking
But they may become one of several analytical interfaces.
The distinction may increasingly look like this:
Dashboard:
“How are we doing?”
Agent:
“Why did this happen?”
Human:
“What should we do?”
The boundaries will not always be that clean.
But the framework captures an important shift.
Final Thoughts
The most important thing about the ChatGPT Data agent is not that it can generate dashboards.
We already know how to generate dashboards.
The more significant development is that business intelligence is moving from:
displaying information
toward:
investigating questions.
Traditional BI has often followed:
Data → Dashboard → Human Interpretation
Agentic BI moves toward:
Question → Investigation → Evidence → Explanation → Recommendation → Governed Action
That changes the responsibilities of almost everyone in the data organization.
Business users gain more analytical independence.
Analysts move toward investigation, validation, and judgment.
BI developers become increasingly responsible for semantic infrastructure and governance.
Data engineers become responsible for creating data environments that both humans and agents can understand reliably.
And dashboards become one component of a broader analytical decision system.
The dashboard is not dead.
It is becoming part of something larger.
For known questions, dashboards remain excellent monitoring surfaces.
For unexpected questions, analytical agents can increasingly explore the evidence.
The future of BI may therefore be less about choosing between dashboards and agents and more about designing a system in which:
dashboards monitor, agents investigate, and humans decide.
Frequently Asked Questions
What is the ChatGPT Data Agent?
The Data agent is available through OpenAI’s Data plugin for ChatGPT Work. It can use connected enterprise data and business context to investigate questions, explain findings, and create interactive dashboards and reports. OpenAI’s current documentation also describes Data plugin use in Codex.
When did OpenAI introduce the Data Agent?
OpenAI announced the Data agent for ChatGPT Work on September 10, 2026.
Which data systems can it connect to?
OpenAI lists supported sources including Amazon Redshift, ClickHouse, Databricks, Google BigQuery, MongoDB, Snowflake, and others. Connected documents can also be incorporated from supported systems such as Google Drive and SharePoint.
Can it build dashboards?
Yes. OpenAI says analysis can be turned into interactive dashboards that users can edit, refine, share, refresh, and customize.
Does it work with existing BI platforms?
Yes. OpenAI documents integrations with BI tools including Power BI, Tableau, Sigma, ThoughtSpot, Omni, and Oracle BI. Exact capabilities depend on the integration, account permissions, and supported actions.
Does the Data Agent respect existing data permissions?
OpenAI states that queries use the connected account’s existing permissions, including applicable table, row, and column restrictions. Administrators can also control plugin and connection availability.
Can the Data Agent take actions?
It can recommend next steps and, where supported, share findings or perform connected actions subject to available tool capabilities, user permissions, and approval requirements.
What is agentic BI?
Agentic BI refers to analytical systems in which AI can perform multiple analytical steps—such as querying, comparing, investigating, explaining, visualizing, and recommending—rather than only displaying predefined reports.
Is Google developing similar technology?
Yes. Google’s Conversational Analytics in BigQuery supports natural-language querying, multi-step analysis, and visual reporting against governed BigQuery data.
Will Data Agents replace analysts?
They are likely to automate some routine querying, reporting, and first-pass investigation. Complex analytical work still requires metric design, validation, business context, statistical reasoning, judgment, and governance.
Official Sources & Further Reading
OpenAI — Now Everyone Can Put Data to Work
OpenAI’s September 10, 2026 announcement introducing the Data agent in ChatGPT Work.
OpenAI Help Center — Using the Data Plugin in ChatGPT Work and Codex
Current documentation covering connected data, semantic layers, dashboards, BI integrations, sharing, permissions, and supported actions.
Google Cloud — Conversational Analytics in BigQuery
Google’s documentation and announcement covering natural-language and multi-step analysis in BigQuery.
Tableau — Agentic Analytics
Tableau’s material on conversational analysis, trusted business context, continuous monitoring, and the emerging agentic analytics model.