
For more than two decades, business intelligence has followed a familiar pattern.
A company collects data.
Data engineers prepare it.
Analysts query it.
BI developers build dashboards.
Business leaders open those dashboards and try to understand what happened.
When something looks unusual, another process begins.
Someone asks:
Why did this metric change?
An analyst investigates.
They write SQL.
They compare segments.
They check historical trends.
They build another chart.
They explain the result.
Then somebody decides what to do.
That workflow is beginning to change.
On September 10, 2026, OpenAI introduced the ChatGPT Data Agent inside ChatGPT Work. The system can connect to approved company data, investigate business questions, build interactive dashboards, refine analysis conversationally, and—when supported and approved—help move from findings into actions through connected tools.
At first glance, this looks like another natural-language analytics feature.
But the bigger change is more important.
Traditional business intelligence asks:
What does the dashboard show?
Agentic analytics increasingly asks:
What happened, why did it happen, what should we investigate next, and what should we do about it?
That moves business intelligence from a primarily reporting interface toward something closer to an analytical agent.
And ChatGPT is not alone.
Google Cloud now offers Conversational Analytics in BigQuery, where users can ask questions in natural language and have an agent perform multi-step analysis directly against governed data. Tableau is also positioning its platform around what it calls agentic analytics, including conversational analysis, monitoring, and actions.
The dashboard is not disappearing.
But its role may be changing.
Table of Contents
The Short Answer
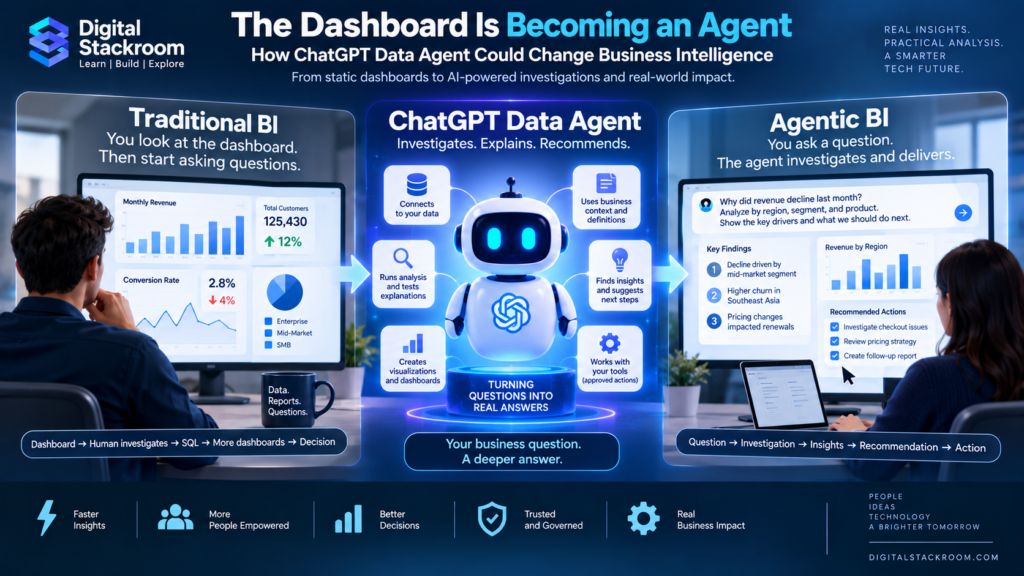
The ChatGPT Data Agent changes the BI interaction model from:
Dashboard → Human notices something → Analyst investigates → SQL → Explanation
to:
Business question → AI agent investigates → Data queries → Analysis → Visualization → Explanation → Recommended action
That is a major difference.
A dashboard usually presents information that somebody decided in advance was important.
A data agent can begin with a question that nobody anticipated when the dashboard was created.
For example:
Instead of opening a revenue dashboard and looking through filters, a manager could ask:
“Why did enterprise revenue decline last month? Compare regions, customer segments, renewals, and product usage. Identify the strongest drivers and show me the evidence.”
The agent can then investigate the question rather than simply display a predefined chart.
That shift—from displaying information to investigating questions—is what makes agentic BI important.
What OpenAI Actually Launched
OpenAI describes the new Data agent as a way for users to connect company data and business context to ChatGPT Work and investigate questions conversationally.
The agent currently supports approved connections to data platforms including:
- Amazon Redshift
- Google BigQuery
- ClickHouse
- Databricks
- MongoDB
- Snowflake
- Datadog
- other connected data sources
It can also incorporate files and documents from sources such as Google Drive and SharePoint when those connections are available.
That matters because enterprise analysis rarely lives entirely inside one warehouse.
A business question might require:
transaction data
metric definitions
documentation
previous dashboards
business context
The Data agent is designed to combine those elements rather than treating the warehouse as the only source of truth.
It Also Understands Business Definitions
One of the biggest problems with natural-language analytics is that business language is ambiguous.
Consider:
“Show me active customers.”
What does active mean?
Possibilities include:
- logged in during the last 30 days
- completed a transaction
- paid subscription currently valid
- used a specific product feature
- generated revenue this quarter
A language model cannot reliably invent that definition.
OpenAI therefore emphasizes the use of organizational business context such as:
- metric definitions
- custom calculations
- dataset relationships
- semantic layers
- trusted documentation
- existing BI dashboards
The Data plugin documentation specifically recommends having a semantic layer containing authoritative definitions and queries.
This is extremely important.
The future of AI analytics is not:
LLM + raw database
It is closer to:
LLM + governed data + semantic layer + business context + permissions
The Evolution of Business Intelligence
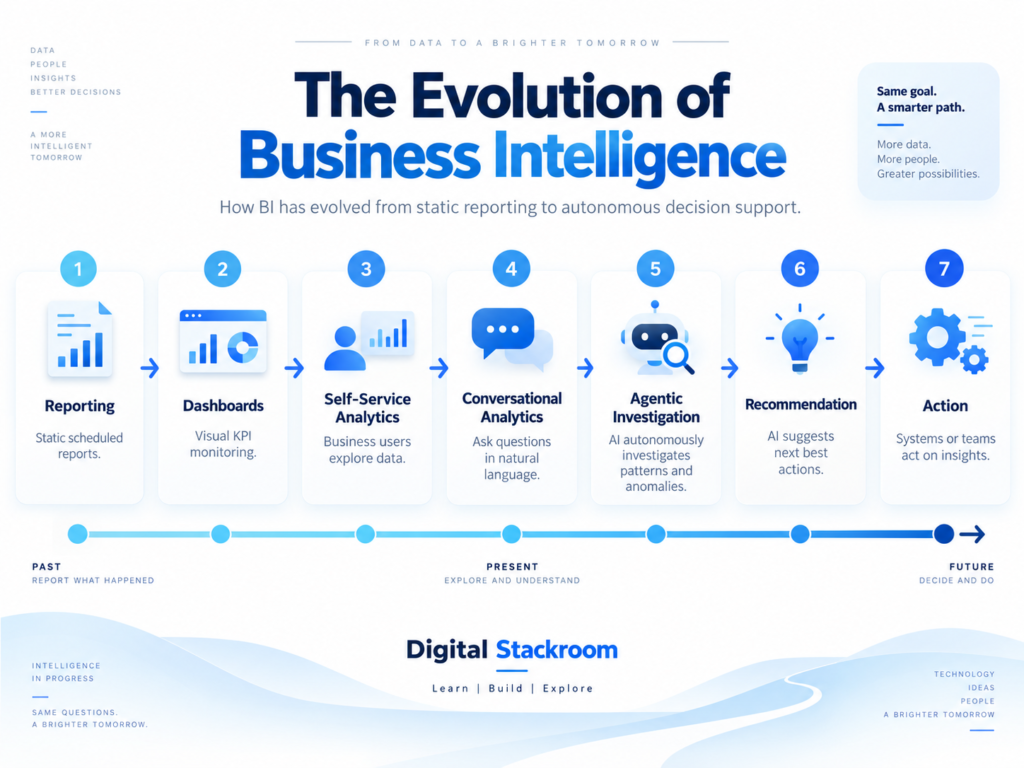
Digital Stackroom’s framework for understanding this change is:
Stage 1 — Reporting
What happened?
Static reports.
Stage 2 — Dashboards
What is happening?
Interactive metrics and visualizations.
Stage 3 — Self-Service Analytics
Can I explore it myself?
Business users get filters, dimensions, and visualization tools.
Stage 4 — Conversational Analytics
Can I ask the data directly?
Natural-language questions generate analysis.
Stage 5 — Agentic Investigation
Why did this happen?
The AI performs multiple analytical steps.
Stage 6 — Recommendation
What should we investigate or do next?
The system synthesizes findings.
Stage 7 — Action
Execute the approved response.
Analytics becomes connected to operational systems.
The major transition is:
Reporting → Exploration → Investigation → Explanation → Recommendation → Action
That is much broader than simply generating SQL from English.
Traditional BI vs Agentic BI
| Capability | Traditional BI | Agentic BI |
|---|---|---|
| Primary interaction | Dashboard | Conversation / goal |
| Questions | Usually anticipated | Can be ad hoc |
| Analysis | Mostly human-driven | Agent-assisted |
| SQL | Analyst-written | Can be agent-generated |
| Investigation | Manual | Multi-step |
| Visualizations | Predesigned | Dynamically generated |
| Follow-up questions | New analysis required | Conversational |
| Root-cause exploration | Analyst-driven | Agent-assisted |
| Business definitions | Semantic model | Semantic model becomes even more important |
| Recommendations | Usually human | AI can propose |
| Operational action | Separate workflow | Can connect to actions |
| Human role | Analyze and interpret | Govern, validate, investigate, decide |
The key distinction is not that AI eliminates BI.
It changes who performs the intermediate analytical work.
A Dashboard Answers a Question Someone Already Thought Of
This is one of the fundamental limitations of traditional dashboards.
Suppose a company dashboard contains:
- revenue
- conversion
- active users
- churn
- average order value
Those metrics exist because somebody anticipated that people would need them.
Now the CEO asks:
“Why are mid-market customers in Southeast Asia renewing at a lower rate despite higher product usage?”
That question might require:
- customer segmentation
- regional comparisons
- renewal events
- usage data
- pricing changes
- support data
- historical cohorts
No existing dashboard may answer it.
Traditional workflow:
Question
↓
Business team contacts analytics
↓
Analyst determines datasets
↓
Writes SQL
↓
Validates joins
↓
Analyzes segments
↓
Creates visualizations
↓
Explains findings
Agentic workflow attempts to compress much of that loop.
The Real Innovation Is Investigation
Text-to-SQL has existed for years.
Generating:
SELECT
    region,
    SUM(revenue)
FROM sales
GROUP BY region;
is useful.
But it is not particularly transformative.
Real analysts rarely receive perfectly specified questions.
A stakeholder says:
“Revenue looks bad. What happened?”
The analyst must decide:
- Which period?
- Compared with what?
- Is the decline real?
- Which products changed?
- Which segments changed?
- Volume or price?
- New customers or retention?
- One geography or global?
- Data issue or business issue?
That is investigation, not query generation.
The new generation of data agents is increasingly designed for this type of multi-step reasoning.
Google’s September 2026 Conversational Analytics update, for example, introduced a preview Deep Dive mode that can break complex BigQuery questions into sub-questions, investigate them, and synthesize the findings into a report.
This is the direction the industry is moving.
A Practical Example: Why Did Revenue Fall?
Imagine monthly revenue falls by 8%.
Traditional Dashboard
The dashboard shows:
Revenue ↓ 8%
The manager sees the red number.
Then asks the analytics team why.
Traditional Analyst Workflow
The analyst investigates:
Revenue
↓
Region
↓
Product
↓
Customer segment
↓
New vs existing customers
↓
Volume
↓
Price
↓
Retention
↓
Possible explanation
That might require several SQL queries and multiple conversations.
Agentic BI Workflow
The manager asks:
“Revenue declined 8% last month. Investigate the major drivers. Compare geography, customer segment, new vs existing customers, pricing, volume, and churn. Show the evidence for each conclusion.”
The agent can attempt to:
understand metric
↓
choose relevant datasets
↓
query data
↓
compare periods
↓
test dimensions
↓
identify drivers
↓
create charts
↓
summarize evidence
↓
suggest next questions
That is a fundamentally different interaction.
Digital Stackroom Framework: The Analytical Investigation Loop
A strong data agent should not simply return an answer.
It should follow something similar to this loop.
1. Clarify
Understand:
- metric
- timeframe
- comparison
- population
2. Establish the Baseline
Confirm that the change actually exists.
Example:
Revenue declined 8.2% month over month.
3. Decompose
Break the metric into likely drivers.
For revenue:
Revenue = Customers × Purchase Frequency × Average Order Value
4. Segment
Test:
- geography
- product
- channel
- customer group
- device
- acquisition source
5. Investigate
Determine where the strongest change occurred.
6. Validate
Check:
- data completeness
- metric definitions
- filters
- anomalies
- historical patterns
7. Explain
Separate:
evidence
from
interpretation.
8. Recommend
Suggest next analytical or operational actions.
This is closer to the way good analysts work than simply generating SQL.
ChatGPT Data Agent Can Build Interactive Dashboards
OpenAI says analysis can be converted into interactive dashboards.
Users can specify:
- metrics
- breakdowns
- comparisons
- layout
- visualizations
and then refine the result conversationally.
The dashboards can be edited, shared, refreshed, and styled using organizational brand guidelines.
That creates an interesting reversal.
Historically:
Dashboard first → questions later
Agentic analytics enables:
Question first → dashboard generated from investigation
That means dashboards may increasingly become outputs of analysis rather than the starting point.
Existing BI Tools Are Not Being Abandoned
One of the most important details in OpenAI’s announcement is that the Data agent is not positioned only as a replacement dashboard platform.
OpenAI says it can work with connected BI systems including:
- Power BI
- Tableau
- Sigma
- ThoughtSpot
- Omni
- Oracle BI
What the agent can do inside each system depends on the integration and the user’s permissions.
This suggests a more realistic future:
AI becomes the analytical interface
while:
existing BI platforms remain governance, modeling, visualization, and distribution infrastructure.
Why the Semantic Layer Becomes More Important, Not Less
Some people assume generative AI will eliminate semantic models.
The opposite may happen.
Imagine your database contains:
rev_amt
net_rev
gross_rev
booked_rev
recognized_rev
Someone asks:
“What was revenue last quarter?”
Which column is correct?
The AI cannot solve this reliably from column names alone.
The enterprise must define:
Revenue means recognized revenue excluding refunds and internal transactions.
That definition belongs in a trusted semantic layer.
Agentic BI increases the number of people who can ask questions.
Therefore it increases the importance of having consistent definitions.
AI Analytics Does Not Fix Bad Data
Data agents can reduce interface friction.
They cannot magically solve:
- missing data
- duplicate records
- broken pipelines
- incorrect joins
- inconsistent definitions
- stale tables
- poor event tracking
Imagine an agent confidently explaining customer churn while the churn table has stopped updating.
The output may look excellent.
The conclusion may still be wrong.
That makes data observability and validation even more important.
Why Analysts Still Matter
A common reaction to AI analytics is:
“If everyone can ask the data directly, do we still need analysts?”
The role is likely to change substantially.
But analytics involves much more than writing SQL.
A strong analyst understands:
- business context
- metric definitions
- causality vs correlation
- data quality
- experimental design
- stakeholder incentives
- statistical uncertainty
- operational constraints
AI can accelerate investigation.
It does not automatically create organizational judgment.
What Happens to SQL Analysts?
The lowest-value part of analytical work is often:
“Please pull these five columns.”
Those requests are highly exposed to automation.
The higher-value work is:
“Which metric should we trust?”
“Is this actually caused by the feature launch?”
“Why do these two systems disagree?”
“Are we measuring the right business outcome?”
“Should leadership act on this result?”
Those questions require deeper analytical thinking.
The career shift may therefore be:
Query Writer
↓
Analytical Investigator
↓
Semantic Model Designer
↓
Data Product Owner
↓
AI Analytics Architect
The analyst becomes less valuable for knowing only SQL syntax and more valuable for understanding how data translates into decisions.
SQL Is Not Becoming Useless
This distinction matters.
AI may reduce the amount of SQL people manually type.
That does not reduce the value of understanding SQL.
Someone still needs to validate whether generated queries contain:
- incorrect joins
- duplication
- wrong filters
- aggregation mistakes
- partition problems
- data leakage
- bad date logic
An analyst who understands SQL can supervise AI-generated analysis.
An analyst who does not may accept incorrect results because the output looks convincing.
The New Analytics Skill: Verification
Traditional analyst workflow emphasized:
write query correctly.
Agentic analytics adds:
verify AI-created analysis correctly.
That requires asking:
- Which tables were used?
- What filters were applied?
- What definition was used?
- What SQL was generated?
- Did the join multiply rows?
- Was the comparison period appropriate?
- Were missing values handled?
- Is the conclusion supported by the evidence?
The bottleneck moves from:
creation
toward:
verification.
We saw a similar shift in our analysis of AI coding agents: when AI makes implementation faster, reviewing and validating the output becomes more important.
That gives you a natural internal link to Blog #7.
Business Users Will Get More Analytics Power
The biggest near-term effect may not be replacing analysts.
It may be reducing the number of routine requests reaching them.
Consider questions such as:
“Show revenue by region.”
“How many customers cancelled last month?”
“Compare this quarter with the previous quarter.”
“Build a dashboard for sales pipeline.”
These requests consume significant analytics capacity despite being relatively straightforward.
If business users can answer them safely through data agents, analysts can spend more time on:
- experiments
- strategic analysis
- forecasting
- data quality
- modeling
- complex investigations
That could improve the leverage of analytics teams.
Google Is Building Toward the Same Model
OpenAI is not alone.
Google made Conversational Analytics in BigQuery generally available in June 2026.
The system allows business and technical users to query BigQuery using natural language, perform multi-step analyses, and generate visual reports.
Google also allows teams to create dedicated data agents with:
- selected tables
- views
- graphs
- UDFs
- metadata
- instructions
- verified queries
These elements provide the agent with business context about how data should be interpreted.
Again, the pattern is:
LLM
governed data
semantic context
analytical tools
Google’s Deep Dive Is Particularly Interesting
On September 3, Google added Deep Dive thinking mode to the Conversational Analytics API in preview for BigQuery.
The feature allows a data agent to break complex questions into sub-problems, investigate them, and produce a detailed synthesized report.
Google notes that Deep Dive queries typically take several minutes and that the feature remains preview-gated.
This shows an important direction.
Future BI may optimize less for:
instant response
and more for:
high-quality investigation.
Waiting three minutes for a serious analysis could be extremely valuable if the alternative is waiting three days for an analyst queue.
Tableau Calls This Agentic Analytics
Tableau has gone even further in its positioning.
At Tableau Conference 2026, Salesforce described Tableau as moving toward an Agentic Analytics Platform, with capabilities across Tableau Cloud, Server, Desktop, and Tableau Next.
Its 2026 announcements include conversational analysis, proactive monitoring, centralized management of analytical agents, and actions that can trigger workflows based on findings.
Tableau’s direction can be simplified as:
Data
↓
Insight
↓
Decision
↓
Action
That is the same broader transition we are seeing from OpenAI and Google.
From Passive BI to Active BI
Traditional BI is mostly passive.
It waits.
A dashboard does not care whether revenue falls.
It displays the number.
Someone must notice it.
Agentic BI can become proactive.
Imagine:
Revenue anomaly detected
↓
Agent investigates
↓
Finds decline concentrated in one region
↓
Identifies checkout failures increasing
↓
Creates incident summary
↓
Alerts commerce team
↓
Human approves response
This is no longer merely visualization.
It is analytical operations.
The Dashboard May Become a Temporary Artifact
This is another important possibility.
Today companies build permanent dashboards for almost everything.
Many eventually become:
- unused
- duplicated
- outdated
- poorly maintained
Agentic analytics changes the economics.
Instead of creating a permanent dashboard for every possible question, users could generate temporary analytical views as needed.
Example:
“Build a dashboard comparing this launch against our previous three launches.”
The dashboard may be useful for two weeks.
Then it disappears.
This could shift BI from:
dashboard inventory
toward:
on-demand analytical workspaces.
What Happens to BI Developers?
BI developers will still matter.
But their highest-value work may move away from producing endless charts.
They may increasingly focus on:
- semantic models
- governed metrics
- reusable data products
- security policies
- visualization standards
- agent instructions
- certified queries
- monitoring
- quality controls
In other words:
less dashboard factory
and more:
analytics infrastructure architect.
What Happens to Data Engineers?
Agentic BI does not remove data engineering.
It may expose poor data engineering faster.
When thousands of employees can query enterprise data conversationally, pipelines need to be:
- reliable
- documented
- discoverable
- governed
- performant
Data engineers increasingly become responsible for creating an environment agents can reason over safely.
What Happens to Data Scientists?
Data agents can democratize descriptive and diagnostic analysis.
That may allow data scientists to concentrate on:
- experimentation
- causal inference
- predictive modeling
- optimization
- simulation
- ML systems
But data agents may eventually invoke statistical or ML capabilities as part of broader investigations too.
BigQuery Conversational Analytics already supports selected BigQuery ML capabilities, including forecasting and anomaly detection functions.
The boundary between BI and data science may become less rigid.
The Biggest Risk: Confidently Wrong Analysis
A wrong dashboard is dangerous.
A wrong analytical agent may be even more persuasive because it explains its conclusion in polished language.
Imagine an agent concludes:
“Customer churn increased because pricing changed.”
But the real cause was:
a broken tracking pipeline.
The explanation sounds reasonable.
The evidence appears structured.
Leadership acts on it.
That is why agentic BI needs stronger verification than ordinary chatbot usage.
The Five Layers of Trustworthy Agentic BI
Digital Stackroom’s architecture for trustworthy agentic analytics has five layers.
Layer 1 — Trusted Data
Accurate, current, governed datasets.
Layer 2 — Trusted Definitions
Semantic models and business definitions.
Layer 3 — Trusted Analysis
Transparent queries, filters, assumptions, and evidence.
Layer 4 — Trusted Access
Permissions enforced consistently.
Layer 5 — Trusted Action
Human approval or policy controls before consequential actions.
If any layer fails, analytical quality deteriorates.
Existing Permissions Still Apply
OpenAI says administrators determine which connections are available and which roles can use them.
Queries are executed using the connected account’s existing permissions, including applicable:
- table access
- row restrictions
- column restrictions
The Data plugin does not automatically expand a user’s underlying data permissions.
This is essential for enterprise adoption.
A marketing employee should not gain payroll access simply because both datasets exist in the warehouse.
Sharing Creates Another Data-Governance Problem
There is an important detail teams should pay attention to.
OpenAI’s help documentation notes that when certain generated dashboards are published through OpenAI Sites, data used in the analysis can be copied into the published site, so users need to pay attention to sharing permissions.
That means analytics governance no longer stops at:
Who can query the source?
It also needs to consider:
Where can the resulting analysis be published?
This becomes increasingly important as AI makes dashboards easier to generate and distribute.
AI Should Show Its Work
One of the best design principles for agentic BI is:
Don’t only show the conclusion. Show the analytical trail.
Users should be able to inspect:
- data source
- query
- filters
- metrics
- assumptions
- comparison period
- visual evidence
OpenAI explicitly encourages users to review evidence and verify source, time period, filters, and metric definitions before relying on results.
That should become standard practice for enterprise data agents.
A Better Prompt for Data Agents
Poor request:
“Why is revenue down?”
Better request:
“Compare recognized revenue for August 2026 with July 2026. Break the change down by region, product, customer segment, new versus existing customers, volume, pricing, and churn. Identify the top three drivers. Show the metric definitions, source tables, filters, and evidence supporting each conclusion. Flag anything uncertain.”
That improves:
- scope
- reproducibility
- transparency
- verification
The future analytics skill is not merely prompting.
It is analytical specification.
Digital Stackroom’s Data-Agent Request Framework
Use:
Question
What are we trying to understand?
Metric
Which business measure?
Population
Which users/customers/orders?
Time
Which period?
Comparison
Against what baseline?
Dimensions
Which breakdowns?
Evidence
What must support the conclusion?
Uncertainty
What should the agent flag?
Output
Dashboard, report, table, or recommendation?
For example:
Question: Why did conversion decline?
Metric: Checkout conversion
Population: US web customers
Time: Last 14 days
Comparison: Previous 14 days
Dimensions: Browser, device, channel, product
Evidence: Query results and charts
Uncertainty: Flag low-volume segments
Output: Executive summary + investigation dashboard
That is much more reliable than:
“Analyze conversion.”
Should Companies Let the Data Agent Take Actions?
Eventually, yes—for some tasks.
But investigation and execution should not automatically be treated as the same permission.
OpenAI says the Data agent can recommend next steps, share findings through connected communication tools, and perform supported actions that the user approves.
A sensible model is:
Low-risk
Automatically:
- refresh dashboard
- create report
- send internal notification
Medium-risk
Require approval:
- update CRM
- create support case
- modify campaign
High-risk
Strong human control:
- change pricing
- approve payments
- delete data
- modify production infrastructure
This connects directly to the AI agent identity security principles we discussed in Blog #8.
Analytics Is Becoming Part of Workflow Automation
Historically:
Analytics tells you what happened.
Automation:
does something about it.
Agentic systems can connect the two.
Example:
Support complaints rise
↓
Data agent investigates
↓
Finds complaints tied to one product version
↓
Creates summary
↓
Opens incident
↓
Notifies engineering
↓
Tracks metric after fix
That combines:
analytics + reasoning + workflow automation.
This is another good internal-link opportunity to Blog #3.
The Future Analytics Stack
A simplified traditional stack:
Data sources
↓
Warehouse
↓
Transformation
↓
Semantic model
↓
BI dashboard
↓
Human
A future agentic stack could look like:
Data sources
↓
Warehouse / Lakehouse
↓
Transformation
↓
Semantic Layer
↓
Data Agent
- query
- investigate
- compare
- explain
- visualize
↓
Human decision
↓
Connected Actions
The Data agent does not replace the entire stack.
It becomes another layer above it.
This Is Why Data Quality Becomes More Valuable
When dashboards were limited to a relatively small group of analysts, problems could sometimes be manually corrected.
When AI makes enterprise data accessible to thousands of people, inconsistencies scale.
If:
“customer”
means one thing in finance and another thing in marketing, the agent must somehow reconcile that.
The organizations best positioned for agentic BI will not necessarily be the ones with the largest AI budgets.
They may be the ones with:
- clean data
- strong metadata
- consistent metrics
- documented definitions
- reliable pipelines
AI magnifies the quality of the foundation underneath it.
Will Dashboards Disappear?
No.
Dashboards remain extremely useful for:
- monitoring
- recurring KPIs
- executive scorecards
- operational visibility
- regulatory reporting
- shared organizational views
The likely change is that dashboards become one of several analytical interfaces rather than the dominant one.
You might use:
Dashboard
for:
“How are we doing?”
and:
Data agent
for:
“Why did this change?”
That distinction is useful.
Dashboards Monitor. Agents Investigate.
This may be the simplest way to understand the future.
Dashboard
Monitor known questions.
Agent
Investigate unknown questions.
Both are valuable.
They solve different problems.
The New Role of the Dashboard
Future dashboards may become:
Monitoring surfaces
Track critical metrics.
Evidence surfaces
Show results discovered by agents.
Collaboration surfaces
Share analysis across teams.
Control surfaces
Allow humans to approve actions.
The dashboard does not disappear.
It becomes part of a broader analytical system.
A Practical Adoption Roadmap
Organizations should not immediately expose every dataset to an AI agent.
A safer rollout is:
Phase 1 — Low-Risk Exploration
Use:
- sample datasets
- non-sensitive data
- read-only access
Validate query accuracy.
Phase 2 — Trusted Metrics
Add:
- semantic layer
- certified metrics
- validated queries
- documented definitions
Phase 3 — Business Self-Service
Allow selected teams to ask routine analytical questions.
Track accuracy and usage.
Phase 4 — Agentic Investigation
Enable:
- multi-step investigation
- anomaly analysis
- dashboard generation
Phase 5 — Controlled Actions
Connect findings to operational tools with approval controls.
The objective is not:
“Give AI access to everything.”
It is:
increase analytical autonomy while preserving governance.
How Should Companies Measure Data-Agent Success?
Do not measure only:
number of prompts.
Measure outcomes.
| Metric | What it tells you |
|---|---|
| Time to insight | Is analysis faster? |
| Analyst request backlog | Are routine requests declining? |
| Query accuracy | Is generated analysis trustworthy? |
| Metric consistency | Are business definitions respected? |
| Human corrections | How often does analysis need fixing? |
| Investigation depth | Are users going beyond basic reporting? |
| Dashboard reuse | Are outputs useful? |
| Cost per analysis | Is self-service economical? |
| Decision latency | Are teams acting faster? |
| User adoption | Do employees actually trust it? |
A successful data agent should reduce the distance between:
question
and
trusted decision.
What Data Teams Should Do Now
Rather than worrying about whether AI replaces analysts, data teams can prepare their infrastructure.
Focus on:
- documenting critical metrics
- cleaning semantic definitions
- identifying authoritative datasets
- improving metadata
- validating important SQL patterns
- strengthening row/column access policies
- documenting common analyses
- building data-quality monitoring
- defining human approval rules
- teaching analysts AI verification
These investments help regardless of which data-agent platform eventually wins.
What Analysts Should Learn Now
SQL still matters.
Python still matters.
Statistics still matters.
But analysts should add:
business modeling
semantic-layer design
AI verification
experimental thinking
causal reasoning
data storytelling
agent supervision
The strongest analyst may increasingly be the person who can turn an ambiguous business problem into a trustworthy analytical system.
The Career Shift May Actually Favor Strong Analysts
AI makes basic querying easier.
That reduces the scarcity value of syntax.
But it increases the importance of judgment.
Consider two analysts.
Analyst A
Knows how to write SQL.
Analyst B
Knows:
- SQL
- how business metrics work
- when data is unreliable
- how to structure an investigation
- how to validate AI analysis
- how to communicate uncertainty
- how to translate evidence into action
AI probably increases the leverage of Analyst B.
The technology automates mechanics.
It does not eliminate expertise.
What This Means for Small Businesses
Agentic analytics could also make advanced BI more accessible to smaller companies.
Historically, sophisticated analytics may have required:
- data engineers
- analysts
- BI developers
- specialized tooling
Smaller businesses often rely on spreadsheets and manual reports.
If data agents make it easier to connect systems and generate trustworthy analysis, more businesses could access capabilities previously associated with larger analytics teams.
The limiting factor becomes:
how clean and accessible their data is.
What This Means for BI Vendors
BI vendors can no longer compete only on:
- visualization
- dashboards
- drag-and-drop interfaces
They increasingly need:
- conversational analytics
- semantic intelligence
- agent APIs
- proactive monitoring
- actions
- governance
- interoperability
The competitive question becomes:
Which platform can turn trusted data into reliable decisions fastest?
The Emerging Battle for the Analytics Interface
This creates an interesting strategic competition.
There are at least three approaches.
Warehouse-first
Examples:
BigQuery and other data platforms.
The agent lives close to the data.
BI-first
Examples:
Tableau and similar analytics platforms.
The agent lives close to governed metrics and dashboards.
AI-workspace-first
Example:
ChatGPT Data Agent.
The agent sits where the user already asks questions and connects outward to data and BI systems.
Each model has advantages.
The eventual enterprise stack may contain all three.
Why ChatGPT’s Approach Is Different
The important advantage of an AI-workspace approach is that analytics does not have to end with analysis.
The same environment may potentially connect:
data
↓
analysis
↓
documents
↓
communication
↓
workflow
For example:
Investigate customer churn.
↓
Find top drivers.
↓
Create dashboard.
↓
Write leadership summary.
↓
Draft Slack message.
↓
Create follow-up tasks.
That turns analytics into part of a larger knowledge-work system.
But Specialized BI Still Has Strong Advantages
Dedicated BI platforms provide mature capabilities around:
- governance
- semantic modeling
- dashboard distribution
- certified metrics
- visualization
- access management
- performance optimization
That infrastructure is difficult to replace overnight.
This is why the likely outcome is integration rather than immediate replacement.
OpenAI’s direct integrations with existing BI systems support that interpretation.
The Bigger Shift: From Business Intelligence to Decision Intelligence
The term business intelligence historically focused heavily on:
understanding the business.
Agentic systems increasingly move toward:
helping decide what to do.
The progression becomes:
Data
↓
Information
↓
Insight
↓
Explanation
↓
Recommendation
↓
Action
The closer analytics gets to action, the more valuable—and more dangerous—it becomes.
That means governance must strengthen at the same time.
Frequently Asked Questions
What is the ChatGPT Data Agent?
The ChatGPT Data Agent is an OpenAI Data plugin for ChatGPT Work that can analyze connected business data, investigate questions, create interactive dashboards and reports, and work with approved BI and data systems.
When did OpenAI launch the Data Agent?
OpenAI announced the new Data agent on September 10, 2026.
Which databases can ChatGPT Data Agent connect to?
OpenAI currently lists approved integrations including Google BigQuery, Snowflake, Databricks, Amazon Redshift, ClickHouse, MongoDB and other supported sources. Documents can also be incorporated from systems such as Google Drive and SharePoint when connected.
Can ChatGPT Data Agent build dashboards?
Yes. OpenAI says it can turn analysis into interactive dashboards that users can refine, edit, share and refresh.
Does it work with Power BI and Tableau?
Yes. OpenAI lists supported integrations with BI tools including Power BI, Tableau, Sigma, ThoughtSpot, Omni and Oracle BI, although exact available actions depend on the integration and user permissions.
Will ChatGPT Data Agent replace Power BI or Tableau?
There is no basis yet to conclude that it will replace them. A more plausible near-term model is that AI agents become a conversational and investigative layer while existing BI systems continue providing governed models, visualization and distribution.
Does it replace SQL analysts?
It can automate some routine querying and dashboard work, but complex analytics still requires metric design, data validation, statistical reasoning, business context and human judgment.
What is agentic BI?
Agentic BI refers to analytical systems where AI agents can perform multi-step analysis, investigate changes, explain results, produce visualizations and potentially initiate governed actions rather than simply displaying predefined reports.
Is Google building similar technology?
Yes. Google’s Conversational Analytics in BigQuery is generally available and allows users to query data and perform multi-step analysis through natural language. Google also has a Deep Dive mode in preview for more complex investigations.
Does the ChatGPT Data Agent respect existing data permissions?
OpenAI says queries use the connected account’s existing access permissions, including applicable table, row and column restrictions.
Final Thoughts
The most important thing about the ChatGPT Data Agent is not that it can generate dashboards.
We already have many ways to generate dashboards.
The more important development is that business intelligence is moving from:
showing information
toward:
investigating questions.
Traditional BI gives us:
Data → Dashboard → Human Interpretation
Agentic BI moves toward:
Question → Investigation → Evidence → Explanation → Recommendation → Action
That changes the role of almost everyone involved.
Business users gain more analytical independence.
Analysts move toward higher-value investigation and verification.
BI developers become increasingly responsible for semantic infrastructure and governance.
Data engineers become responsible for making enterprise data agent-ready.
And dashboards evolve from being the final destination of analytics into one component of a larger decision system.
The dashboard is not dead.
But it may no longer be the smartest thing in the room.
The emerging interface is the agent sitting above it—asking questions, exploring evidence, generating views, challenging assumptions, and helping humans move from:
“What happened?”
to:
“Why did it happen?”
and eventually:
“What should we do next?”
That may be the next major chapter of business intelligence.